Showing posts with label Supply Chain Delays. Show all posts

Tuesday 14 June 2022

Dude where's my cargo? Supply Chain Visibility Example


Dude where's my cargo? 

Estimated reading time: 4 min

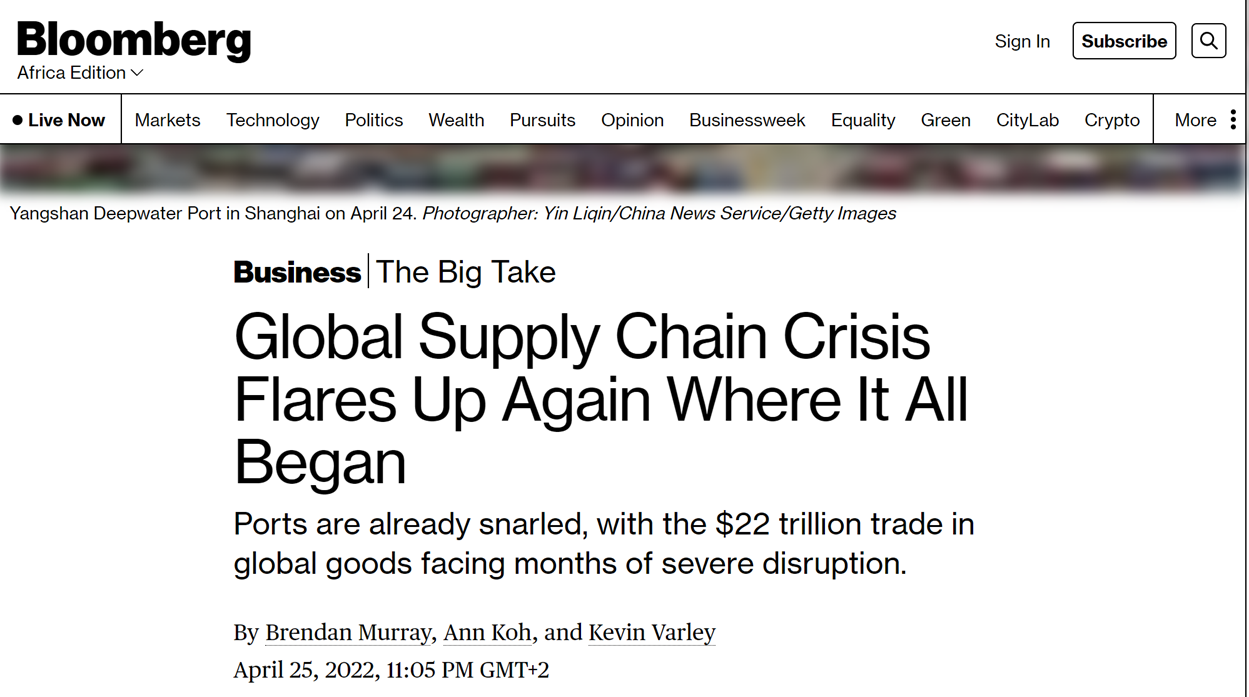
A hypothetical supply chain risk scenario unfolding in real-life 

Short summary translation of the above newspaper article that appeared in the Rapport newspaper on 12 June 2022: 

A transport broker contracted a reputable transport company and made available cargo to be transported with the very reasonable expectation that said cargo (maize meal) would be carried from Point A (Meyerton SA) to Point B (DRC) by the appointed transporter. 

Why was this a reasonable expectation?  - The transporter 

  • was a reputable and reliable company,
  • specialised in cross-border cargo,
  • had good references from a range of clients,
  • had done this type of trip before,
  • appeared to had a reliable fleet, and
  • the necessary minimum payments were made.

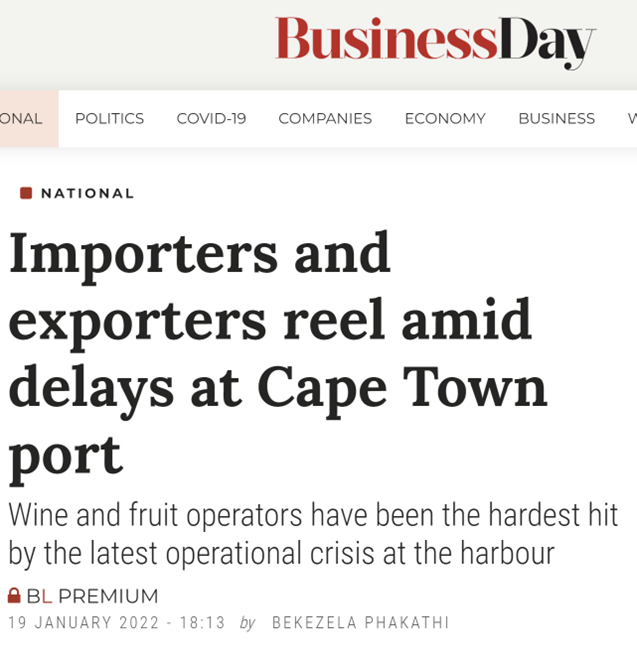
However, according to the newspaper article, the client in the DRC informed him after some time that some scheduled deliveries never took place, despite payment and import clearances. Due to delays caused by border clearances and Covid19-related supply chain delays, the time required to do a one-way transport increased from an average of 14 days to 45 days. This made it difficult to gauge progress. Despite querying the progress often, the transport broker was assured all is under control and in accordance with the schedule. For this reason, the problem was not picked up much earlier. 

It is only after a phone call was received from a (probably) irate client in the DRC, that the transport broker's lingering suspicions got the better of him and he realised something major was amiss. He then jumped in his car, drove to the transporter’s premises, and much to his shock and horror discovered rows of semi-covered pallets of maize meal exposed to the elements: sun, wind, rain, and insects.  

This matter is now before the court.

This situation was preventable

We are using this real-world example, not in order to finger-point any type of transport service provider or attempt to allocate blame, as that is the matter before the court. For this reason, we also removed the names of the parties involved as it is not particularly relevant to the point being illustrated. 

This case, however, is a real case study where a number of parties to a cargo shipment that has to be transported from A to B have to rely on each of the other role players to do the right thing at the right time and thereby prevent any potential transport risk from materialising.    

The client (and their broker):

  • Had to rely on the verbal confirmation of the service provider/transporter without any 3rd party or IT system confirmation of facts,
  • Did not have reliable means of communication with drivers,
  • Did not have agents at way-points to confirm status,
  • Did not have any access to real-time reporting on the location of the cargo, and was, therefore, unable to track actual trip progress made,
  • Did not have any real-time information on the condition of the cargo, and was, therefore, unaware that the cargo was left standing in the sun, wind and rain for an extended period of time.

Supply Chain Visibility

With the help of modern technology, some of these risks can be detected, monitored, managed and in some cases even prevented:

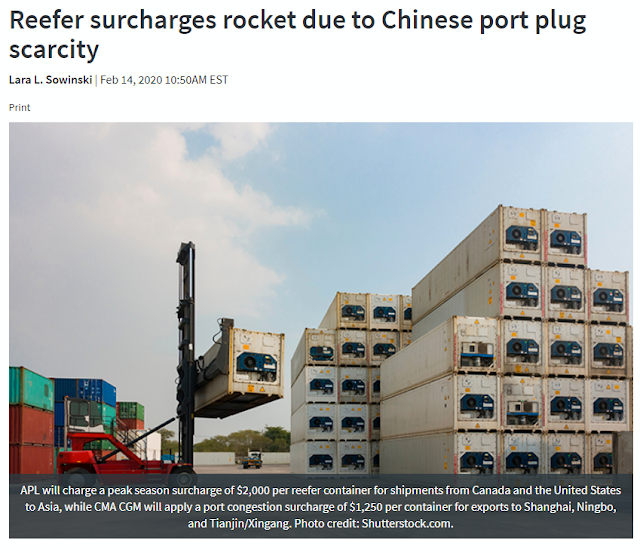
  • Cargo items being exposed to elements (sun, wind, rain) or experiencing fluctuations in temperature leading to damages, losses, insurance, and legal claims,
  • Transport and Border Delays, 
  • Late deliveries,
  • Unnecessary detours, 


If your company or somebody you know had a similar horror story, there are now Internet-of-Things (IOT) solutions that can assist you to monitor your fleet from the relative comfort of wherever you have internet access: a Fleet Visibility Platform offers you the following advantages

  1. Transparency - having real-time end-to-end IOT visibility into where your operational assets/inventory/shipments are, with hyper-accurate location data, despite using different 3rd party logistics providers or channels, such as warehouses, handlers, or distributors in multiple locations. 

  2. Keeping track of critical performance data - Key indications such as transit time, stops and halt periods, loading times, and whether or not unauthorised pauses or unexpected delays happened are all available on the fly. This gives you information, allowing you to predict whether your operational assets, inventory, or freight will arrive on time, ahead of schedule, or late. It also allows you to keep track of the performance of your suppliers.
  3. Auditability - Having an audit trail to demonstrate the real-time condition of fragile or high-value inventory / perishable shipments. Knowing whether the goods were handled in accordance with the SLA and/or regulatory compliance standards throughout the route.
  4. Real-time condition reporting – Knowing the status of your perishable/fragile shipments in real-time, as well as being able to pinpoint and apportion blame for damage as it occurs.

5. Actionable insights in real-time to:

  • Protect your business operations against both known risks and unforeseen events and disruptions.
  • Respond to and manage exceptions by making fact-based decisions.
  • Lower expenses and minimise damage to perishable and fragile goods, as well as shrinkage and/or losses of high-value items.
  • Improve the quality of forecasting and inventory management,
  • Maximize operational efficiency,
  • Increase customer satisfaction,
  • Improve profitability,

 For more information please visit: Cogniplex Visibility Solutions 

Need more information? Want to start a pilot project? Please contact us


If you have found this article useful or thought-provoking, please share it with others in your company or industry.

#IOT  #supplychain #riskmanagement

Wednesday 1 June 2022

Operations and Supply Chain Visibility - what is it and why do you need it?


SYNOPSIS: Having no visibility, real-time insights, or reliable data on business operations or the current status of your supply chains is conceptually not too far removed from driving blind. This article briefly explains some use cases and advantages of operational and supply chain visibility platforms and systems.

ESTIMATED READING TIME: 5min

First posted on LinkedIn - read the ORIGINAL POST here

You wouldn’t drive your car blindfolded, would you?

Driving blind is a dangerous and potentially life-threatening practice, perhaps best left to trained movie stunt professionals on movie lots. The rest of us, social influencers included (even those with very deep pockets and extensive liability cover), should best stay far away.


While the image in the title has been Photoshopped somewhat, this image ☝️☝️ is the real deal and comes from a YouTube video in which a popular YouTuber filmed himself driving blindfolded. The video sparked a public outcry and negative news coverage, as one could expect. This resulted in the video initially being age-restricted and demonetised, and then subsequently removed by YouTube.

The risks caused by driving blind are rather obvious and easy for all to see - apart from the aforementioned YouTuber, and include at least the following:
  • Inability to see where you are going.
  • Inability to see how the situation around your vehicle and inside the vehicle is changing in real-time.
  • Inability to effectively make informed decisions in real-time or timeously execute corrective action to best adjust to the developing risks and changing situations around you.
  • You are very likely to cause or end up in an accident, incurring costs, losses and liability claims, including but not limited to loss of life.
Swimming in a Sea of Business, Operational and Supply Chain Risks

The same goes for managing and coordinating the various activities inside a business: in today’s equally volatile and fragile economic climate, no accountant worth his salt will manage the finances of a business blind-folded either – meaning without knowing with a reasonable degree of certainty how much the expenses are, who needs to be paid or when the payments are due, or how many invoices are outstanding and how much is owed by each debtor.

If visibility is such an obvious requirement for driving and finances, why are there parts of business operations that are still “operating in the dark”, figuratively speaking?

Have a look at almost any media outlet or newspaper and one will see headings describing losses, damages, delays, bottlenecks, shortages, and other supply chain challenges brought on by a mix of internal and external factors as well as foreseeable and unforeseeable risk events. Many existing but previously manageable challenges were upgraded and further exacerbated by the great Supply Chain crisis of 2021-2022. This in turn was brought on by (some would say ill-considered) pandemic emergency measures, which caused systemic shocks, stock outages, and shortages, shutdowns of suppliers (both temporary as well as permanent in nature); significant supply chain delays; economic hardship; and increased volatility around the world. In the process, some entirely new problems were created. The only constant is change.

In no specific order, below please find a short list of 12 examples of current supply chain and operational challenges, many of which may or could affect business operations in the Southern African (or international) market:


Please scroll through this list. While this is by no means intended to be an exhaustive or comprehensive list, it does highlight the wide range of challenges that local businesses confront from time to time, some of which occur daily, including:
  • Supply disruption due to lockdowns 
  • Cargo and freight handling delays, accidents and incidents
  • Wastage, damages and shrinkage to perishable foodstuffs, fresh fruit and veggies
  • Political unrest, riots and looting targeting the supply chain, transporters, and warehouses
  • Import and export delays, shipping delays, border congestion and delays
  • Counterfeit products, supply chain control gaps, shortages and stock-outages
  • Natural disasters, flooding, transport infrastructure (ports, docks and roads inaccessible), unavailability of services due electrical outages, water bursting, etc

Many of these problems are caused by external factors beyond the control of the average company; they are not isolated occurrences; they are not limited to specific suppliers or carriers; they are not necessarily industry-specific; and they can and do affect the entire Southern African economy, including international supply chain networks. And these issues have disastrous effects on operational efficiency and bottom-line profits. Research by McKinsey indicates that “supply-chain disruptions cost the average organization 45 percent of one year’s profits over the course of a decade.”. For South African businesses, the cost of e.g. importing goods has increased significantly, with a 400–500% cost increase for freighting a 12-meter container by sea from China to South Africa, even for large organisations with bargaining power. On some international trade routes, shipping costs have increased much more. Risk has increased significantly. Many of these costs are passed on to the consumer, who is now faced with rapidly increasing living expenses, rising inflation, and considerably less discretionary spending power, which, in turn, reverberates throughout the economy.

It is therefore advisable to use every tool in your arsenal to pro-actively respond to the changing situation around you. Because every load counts.

So what is Visibility?


Visibility platforms (software + tracking devices) compile and analyse real-time data across the shipping journey to provide end-to-end shipment visibility across different industry applications.

This means a commercial customer has the ability to track-and-trace assets or inventory live and in real-time, e.g. from the point where the item/shipment leaves the farmer's, manufacturer’s, supplier’s, or service provider’s warehouse/distribution centre up to the point where it arrives at the destination, allowing you to keep track of the current location, condition, and status of these items throughout the journey.
  • Visibility platforms are frequently used for supply chain visibility but can have other related applications, e.g. large and complex business operations. It is important to understand that the visibility requirements can vary somewhat between e.g. a logistics business/farmer/manufacturer/distributor/retailer/importer/exporter, which could be very different from the visibility requirements of a bank or a pension fund.
  • Different technologies are on offer and the platform can obtain data via API, directly from telematics or other types of tracking IOT devices.

6 Reasons why your business needs visibility


Consider how your company could profit from having Real-Time Visibility into your operations and access to a Single Version of the Truth:

  1. Transparency - having real-time end-to-end IOT visibility on where your operational assets/inventory/shipments are, with hyper-accurate location information, despite using numerous 3rd party logistics providers or channels, such as warehouses, handlers, or distributors in multiple locations
  2. Tracking important performance data - Key indicators such as transit time, stops and halt periods, loading times, or whether unauthorised pauses or unexpected delays occurred are all available on the fly. This provides you with knowledge, allowing you to forecast if your operational assets, inventory, or freight will arrive on time, ahead of plan, or behind schedule. And allows you to keep track of supplier performance.
  3. Auditability - Having an audit trail to prove real-time conditions of fragile or high-value inventory / perishable shipments. Knowing if the cargo was handled in accordance with SLA and or regulatory compliance requirements for the duration of the trip.
  4. Real-time condition reporting - Knowing the condition of your perishable/fragile shipments in real-time, and being able to pinpoint and allocate accountability for damage if and when it occurs.
  5. Real-time actionable insights to:

  • Make fact-based decisions to respond to and manage exceptions,
  • Reduce costs and minimise damage to fragile and perishable goods, shrinkage and or losses of high-value goods,
  • Identify operational bottlenecks,
  • Make data-driven decisions to develop business cases, mitigate risks or loss prevention strategies,
  • Improve the quality of forecasting and inventory management,
  • Maximise operational efficiency,
  • Increase customer satisfaction,
  • Improve profitability,
  • Withstand and defend against disruption.

The aforementioned cover some of the advantages that Visibility platforms have to offer – including aggregated, real-time data about the movement of freight along the shipping journey, providing end-to-end shipment visibility.

6. For rather obvious reasons, then, it comes as no surprise that research by the authoritative market intelligence and investment advisory firm, CBInsights, emphasised the importance of prioritising supply chain and operational visibility platforms as a focus area for retailers. What’s good for the goose …er retailer, is probably worth seriously thinking about for other players across different value chains and different industries, too.

So, if given a choice, you would not drive blindfolded, right? Where do you see Visibility adding the most benefit to your business?


Need more information? Want to start a pilot project? Please contact us


If you have found this article useful or thought-provoking, please share it with others in your company or industry.

#IOT #retail #supplychain #riskmanagement

Photo-credits:

All media belongs to their respective owners.

Shark photo Jacob Owens + Warehouse Photo by Bernd Dittrich found on Unsplash

Tuesday 24 March 2020

BUSINESS UNUSUAL IN A TIME OF CORONAVIRUS (PART 1) - WHERE AND HOW DID THIS CRISIS ORIGINATE?


Doing business in a time of Coronavirus/Covid-19, Supply Chain disruption and Business interruption - Where and How did this crisis originate?


NOTE:


  • This is a developing situation. Accordingly, role players continue to react and markets continue to adjust to the emerging situation. The historical data, facts and figures contained in this article were accurate at the time of publication, but statistical figures and some facts can change over time (e.g. share prices, mortality figures, etc). References below for further reading.
  • This article will be posted into 3 parts:

PART 1 – What happened and how did we get here?

2020 is fast turning into a watershed year. In early January the global economy was chugging along nicely, with some international Indexes peaking around record highs. However, New Year euphoria was cut short as news gradually broke about a virus spreading in Wuhan, China.

Figure 1 - Wuhan Map

Wuhan is a hi-tech hub and China’s “motor city”. It is the biggest city in Hubei province, known as the “thoroughfare of China” by virtue of being a transport and industrial hub for central China and the region’s political, economic and commercial centre. More than 300 of the world’s top 500 companies have a presence here. 

By 13 January, the first case was identified in nearby Thailand. By 22 January 2020, the novel coronavirus (subsequently referred to as Covid-19) had spread to major cities and provinces in China, with 571 confirmed cases and 17 deaths reported. On 23 January 2020 (2 days before Chinese New Year), authorities informed residents of Wuhan of an imminent lockdown from 10 am. An estimated 300 000 citizens left the city immediately. The lockdown spread as quarantine was imposed in various cities and regions. On this same day that the lockdown occurred, the first case of Corona was identified in Singapore. From early February, Chinese authorities began shutting down factories in a desperate attempt to halt the spread of the virus.

This plan did not work, and virus contagion spread to the rest of the world. And economic contagion followed – the following is a summary: 
  • China is the world's manufacturer and is also the world’s largest container cargo handler and home to seven of the world's 10 busiest container ports – processing around 30% of global traffic or around 715,000 containers a day in 2019
China factory activity plunges
  • The lockdowns meant that factories could not get stock shipped out that was already manufactured and simultaneously stopped manufacturing altogether. China’s manufacturing activity plunged to an all-time low in February, with the official manufacturing purchasing managers’ index (PMI) slowing to 35.7, according to the National Bureau of Statistics (NBS). Comparatively, during 2008’s Financial Crisis the manufacturing PMI only dropped to 38.8 in November 2008. Services were similarly affected, and the services index almost halved last month to just 26.5 from 51.8 in January (and first time lower than 50 since the index was started 15 years ago in late 2005.
 Reefer surcharges rocket due to Chinese port plug scarcity

  • Incoming cargo clogged ports and shipping lines started charging surge fees for refrigerated containers importing food. Some cargo ships left China carrying as little as 10% of TEU capacity, others cancelled trips. 
  • Overall China’s exports and imports plunged. Exports fell by 17.2% in January and February combined compared to the same period a year earlier, according to the General Administration of Customs
  • A survey by Beijing-based think tank the Shanghai International Shipping Institute shows that capacity utilisation at the main Chinese ports fell by 20-50%, while more than one-third of ports said storage facilities were more than 90% full.
 Wuhan residents trickle back after lock down

International impact

This lowered throughput had a knock-on effect on the other side of the Supply Chain in receiving countries:
  • LA handled 705 000 containers in Feb 2019. The same period Feb 2020 was down to 544 000 or 22.87%. By 18 March Los Angeles ports have seen 40 + “blank sailings” - ships scheduled to arrive that didn’t, numbers previously unheard of. 
  • On the Asia-Europe trade route, at least 61 cancelled sailings have been announced, representing a 151,000 TEU capacity reduction. China typically represents about 30% of Hamburg's container throughput and about 25% of Rotterdam's. Rotterdam Port Authority estimated that a 1% drop in its annual volume, which after recording throughput of 14.8 million TEU would amount to 148,000 TEUHamburg harbour reported a 40% plunge in trade volumes.


Oil Price War

 Oil war

Then, on 8 March 2020, after a potential oil production cut agreement with Russia fell flat, Saudi Arabia initiated a price war with Russia. This triggered an immediate international fall in the price of oil, with US oil prices falling by 34%, crude oil falling by 26%, and Brent oil falling by 24%.  Oil prices dropped to 18-year lows. For more info see here and here 

CONCLUSION

The fallout and contagion (both medically and financially speaking) spread nearly globally in the space of 3 months. This caught many off-guard, as global supply chains and financial markets were disrupted. In the next post, we will consider the potential and combined impact of the virus, supply chain interruptions and business disruption on commerce and industry, and potentially on your own business or organisation where you work.

If you like this post, please Like, Share and Comment


For more information, visit our website on www.cogniplex.co.za. A copy of this article is also posted on Linkedin.com 

All original artworks remain the property of their respective owners.

IOT Supplychain Visibility Test 947

  Supply Chain Visibility real-world experiment @ Ride Joburg 947 Cycle Challenge This past weekend was one of the highlights of the cycli...