Saturday 28 October 2017

30 Different Ways to Build a Billion Business (Part 2)

30 Different Ways to Build a Billion Business (Part 2)


28 Oct 2017

Abstract


This post is the 2nd part in series of blog posts focussing on various approaches to increase company revenue/turnover and discusses each in brief. 

If you have not yet read the 1st post - we highly recommend that you do for context. You can find it here: 30 different ways to build a 1 billion business (Part 1)

In these blog posts, some well-known international and potentially lesser known examples from South Africa or neighbouring countries are included. These blog articles are aimed at business readers, ranging from corporate executives to entrepreneurs and founders searching for strategies to increases revenue. It is equally suitable for interested parties who wish improve their general knowledge around strategies and growth.  


The full series will contain 3 or 4 articles. 

Estimated reading time:
8 min or less

============

0. Background


In Part 1 of this blog, we looked at the roles of the following factors in achieving revenue target:


           1. Product & Market Mix
          2. Price

In this blog, we continue our journey.


3     Change sales volume


3.1        Sell more units per transaction to increase volume


Selling more units results in higher total sales. One technique to increase sales volume is called Bundling. Bundling is the combining goods and or services in a package deal – sold together. The package deal is typically sold for a marginally lower price than when the component parts are purchased individually. This, in turn, increases turnover. Typical examples include McDonald's Meals, which include a drink, chips (Americans call them fries), and burger, or Office type software including a word processor, spreadsheet as well as presentation application in one package deal.

Once McDonald's introduced the bundled meal concept to SA, other fast food retailers were fast to cotton on and cashed in on the same concept. Now, most offer their own variation on the same idea.

Bundling works well then there are benefits of scale in terms of production or distribution, or when production set-up costs or customer acquisition costs are high.


          3.2        Sell more frequently


Increasing the frequency means finding an effective way to shorten the intervals between procuring of goods or services. If customers ordinarily on average visit your restaurant once every 3 months, develop a strategy to bring them back once per month or more. If they check in monthly, bring them back weekly.


Starbucks Meme
Fig 1.1  Can't get enough Starbucks

It is important to note that purchase frequency varies between industries – while it is very plausible to see the same customer week after week in a Starbucks coffee shop, it is highly unlikely that the same customer will buy brand new furniture or a new car every month, or even every year. In that case, the program will be focussed on bringing the customer back to the same supplier, once he is ready to buy another vehicle.

           3.3        Sell over a longer period


Another way in which increased sales could be achieved is to start subscription-based services, in terms of which fixed monthly payments are charged for a pre-defined service. Cell phone or mobile subscription fees are a good example of this. Users pay the same basic amount based on a pre-defined usage level over a fixed period – locally that is around 2 years.

Maintenance plans sold with new vehicles is another way in which the customer can be tied into a specific brand for a defined number of years, or until as they sell the vehicle.

Yet a further variation on the same theme is SaaS (Software-as-a-Service), or PaaS (Platform-as-a-Service) type software such as DropBox, SalesForce or Slack
  • Under the traditional sales model, your would buy software for use on your PC or Mac or deployment on the company servers. 
  • On the SaaS-basis you would subscribe to use the same software, which is based in a cloud. 
  • In essence, as a user one has access to all the same functionality you would have had, had you bought the actual software bundle and installed it on locally. 
  • Key differences are that the software remains on the cloud, and typically no significant software installation happens on locally. 
  • Pricing is substantially lower compared to outright purchase, but the user is tied to usage conditions around the number of users or volume of allowable usage, in return for a perpetual rental fee. 
  • Ownership normally also does not transfer to the user. 
  • The user usually has to some extent the option to decide the period of the rental.

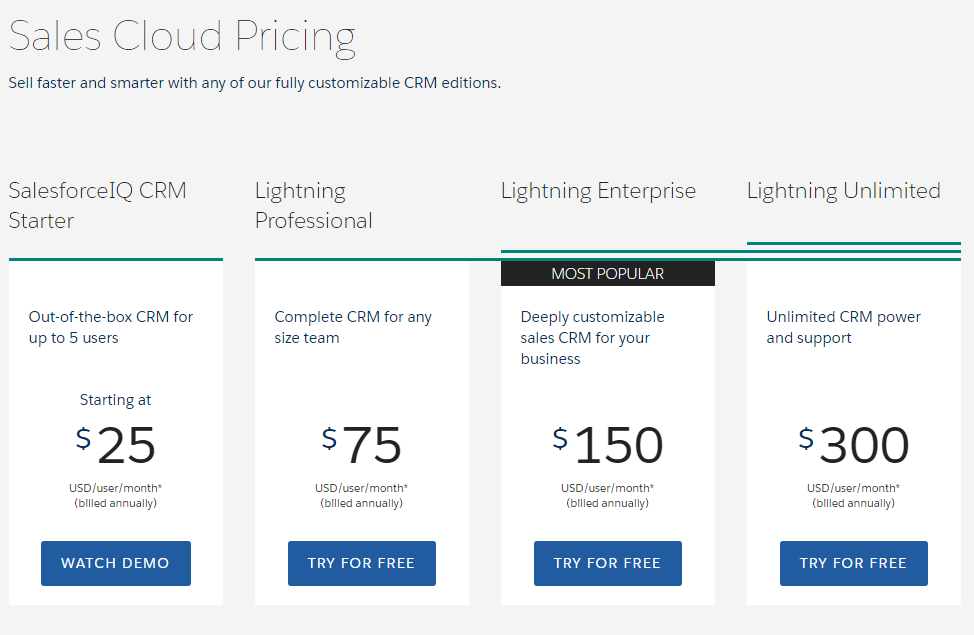
Fig 1.2 SalesForce Pricing

This is, therefore, a pay for usage and availability basis rather than paying for ownership and the rights and obligations that go with that. This is again a demand vs supply consideration. If you were to sell specific software, there could be X users who might be interested in purchasing it at the full sales price. On a SaaS-basis the price to use the software could be cheaper, and availability guaranteed. This could, therefore, increase the number of users compared to the traditional ownership model. SalesForce specifically has shown very strong growth and reached $10 billion annual sales in Aug 2017


           3.4        Offer volume/quantity discounts


Volume discounts are incentives offered to customers that result in a reduced price per unit, subject to taking a specific number of units of the same product. Buy 5-for-the-price-of-3 is an example of a volume discount offered in the consumer market. 

Commercial or industrial buyers might have tiered discount structures where the discount is directly tied to the volume procured – once a specific tier is achieved pricing might reduce further.


          3.5        Offer frequent buyer discounts or other forms of customer loyalty programs


Frequent buyer discounts is a further approach to retain and reward customer loyalty. These programs come in many forms, one of which is frequent flyer programmes which entitle customers to further discounts. It is also worth noting that these types of programmes further tie in the buyer – the likelihood of next purchase increases if it counts towards a perceived real future benefit.

Ster Kinekor (a South African national movie theatre chain) first rolled out a loyalty program in the early 1990s initially targeted at a hugely grateful student audience. In terms of the specific promotion, participating students received a student discount on Tuesday nights – a traditionally dead night. The program was so successful it was rolled out to all customers countrywide. 

Discovery Vitality Customer Loyalty Program
Fig 1.3 Vitality Loyalty program rewards members with discounts and special offers

Other examples of loyalty programmes include Discovery medical fund’s Vitality program whereby joining medical fund members get rewarded for regular gym attendance and participation in fitness-related activities e.g. by way of discounts on fitness devices or sports equipment. This program is reciprocally beneficial to the underlying medical fund - fund members who are fit and stay in shape typically get sick less and claim levels could be lower.

British Airway’s Avios loyalty program is another example of a loyalty program.


           3.6        Offer complimentary services - Cross-sell


Cross-selling is the process of selling additional, and even potentially unrelated items to a client while they are in the process of buying product A.

Example: When Client at a camping store enquires about sleeping bags, the sales assistant, in addition to making the sale on the sleeping bag, also makes the customer a competitive offer on a tent.


Cross-Selling in an e-Commerce
Fig 1.4 Cross-Selling in an e-Commerce example

Pic courtesy of Templates-master.com. 

Notably the more successful e-Commerce stores frequently use this tactic with the well known “Customers who bought this product also bought…”


           3.7        Minimum sales quantities


Minimum sales quantities come into effect when e.g. packaging forces clients to buy more than 1 unit at a time, e.g. in cases or batches of 6 or 12. Distributors also use this to great effect – in order to qualify as a reseller, buyers may be required to achieve regular minimum sales defined either in units or monetary value.


4     Sell to more Customers


           4.1        Change the sales model – traditional commerce


Some of the more traditional options available to attract more customers include:

o   Increases sales staff,
o   Agents,
o   Branches (more locations),
o   Distributors,
o   Franchises.

As these are all common and well-understood concepts, we will not go into detail to discuss these.

Steers Fastfood brand - footprint in Johannesburg
Fig 1.5 Steers (fast-food brand) footprint in Johannesburg


All of the above-listed methods, when implemented and managed correctly, could contribute to increased exposure to clients, increased geographical footprint, and ultimately result in increased sales.


   4.2        e-Commerce


Enabling your business for e-Commerce could depending on the product or service, make a significant impact in terms of sales. The advantages of e-Commerce above a traditional brick-and-mortar sales location (i.e. a shop or branch) is that it can significantly decrease the cost of fixed and variable overheads associated with running each location. Furthermore, the internet has much wider reach (specifically if your product goes viral), and it is open 24/7, even when you are not, translating into sales around the clock. 

Refer to the Steam example in Article 1. Another brilliant example is Dollar Shave Club

Dollar Shave Club was started by founder Michael Dubin after discussions with an acquaintance, who was stuck with an excess stock of razor blades (towards the end of 2010). Michael realised there was an opportunity in the men’s shaving market, which up to that point was dominated by premium-priced razor blades from Gillette and Schick. He formally started in 2011 and launched a beta site for direct-to-consumer subscription service for razors.


                       Fig 1.6 Dollar Shave Club's video went viral

In March of the next year he relaunched his site and on 6 March 2012, he published the video (which you can see above) which at that time was hosted on the company server. The video went viral and promptly crashed the company server in the first hour. All of his inventory was sold out in the first 6 hours. On the same date, he also announced that his company received $ 1 million in seed funding.

The company expanded in related men’s’ grooming products in the years to follow, reaching 30 products across five categories by 2017. Dollar Shave Club grew from zero customers in 2011 to more than 2 million in 2016 and was bought out by Unilever for $ 1 Billion in June/July 2016.


       4.3        Change demand


Improving demand will impact on the volume sold as long as the production capacity exists to satisfy the demand (assuming that maximum demand/saturation is not reached). 


4.3.1   Increase demand - Improve the market appeal


One specific example of a very successful brand turnaround is Land Rover – a luxury niche brand. In the late 1990s, Land Rover was in trouble, having been plagued by quality problems and perceived problems of quality and reliability in pre-dating years. They were passed around from BMW to Ford, the 2008 financial crisis hit, and they were once again taken over by new owners. This time it was India’s Tata group in 2008.  


Range Rover Velar
Fig 1.7: 2017 Range Rover Velar. Not many people will do this with a brand new Range Rover. But it is nice to know you could, if you wanted to

Tata prioritized costs management, cash management, innovation and new product development as well as manpower development. All of this greatly contributed to the concerted effort that went into the Brand Image make-over. Considerable effort went into increasing the quality (tacit and perceived) and user appeal of their products, resulting in a changing of market perceptions.

From 2010 - 2016 Land Rover managed to increase unit sales by ±243%. Unfortunately, group revenue figures are combined for both Land Rover and Jaguar and we could not split out the Land Rover portion or find verifiable figures to reflect specifically only the increase in Land Rover turnover. 

4.3.2   Find alternative uses for your product or service

Finding additional uses for your product (or service) increases the usefulness and value of the offering to the buyer. This, therefore, could increase the demand, resulting in a higher volume of sales. In specific instances, the incremental value increases might justify an increased sales price. 

Let’s use 2 common everyday items as an example:


  • Toothpaste, in addition to its traditional use, can be used to touch up drywalling, de-fog new scuba masks, clean shoes, clean the residue off steam irons, polish jewelry, clean residue of sinks, polish out scratches on CDs, and get the luster back in dull vehicle head lights. 

  •  Coca-Cola, or Coke as it is more commonly known, in addition to being a refreshing fizzy drink, can also be used for the following purposes:


Fig 1.8 Coke, not just a fizzy drink

as greasy stain or blood remover for clothing, rust    remover, remover of oil stains from garage floors, engine  cleaner, can assist in loosening rusty bolts, kills slugs and snails, cleans burnt pots and pans, descales kettles and baths, cleans toilets, allegedly, offers symptomatic relief for jellyfish stings (it should be noted that there is some debate about its efficacy in scuba circles), cleaning car battery terminals, pacifies upset stomachs, can be used as an ingredient in cakes or as a meat tenderiser, useful to fertilize Azaleas, and increases the acidity of compost … to mention but a few.


         4.3.3    Limit quantities or increasing price


Limiting quantities can e.g. increase demand if e.g. the product is perceived to bestow status or some other benefit upon its buyer, or if there is huge demand for the product and if users are not that price sensative. 

For luxury goods or exclusive consumer items the strategy of limiting supply is acceptable, however, this rule of thumb does not apply across the board for all products or services. There are however significant ethical, moral and legal considerations that apply depending on the product and market:

Fig 1.9 Acceptable pricing strategy varies from one industry to another


In December 2015 one pharmaceutical company, Turing Pharmaceuticals, (and its CEO) shot to infamy when they increased the price of 62-year-old drug, Daraprim, from $13.5 to $750 per unit. More than 5000% increase literally overnight. After a huge outcry, the price was reduced, but not back to original price levels.

         4.3.4    Satisfy more of the demand - Scale upmarket and downmarket


Volkswagen is an example of a brand that have scaled their product offering upmarket and downmarket to cover a very wide range of price points. 


VW Brands
Fig 1.10 Different vehicle brands in the Volkswagen stable as at 2017


The VW group covers motoring and transport needs and wants, ranging from the ultra-expensive Bugatti brand, super-fast Lamborghini, and luxurious Bentley down to Seat, Skoda and economy VW models for the more budget conscious. The product range also includes heavy and medium-sized commercial vehicles (MAN, Scania, and VW Commercial Vehicles), as well as Motorcycles (Ducati). In doing so they are able to address a wide range of prospective buyer’s needs and requirements. 

Using the mascot matrix, moving upmarket or downmarket can be achieved when growing products or services to include the level above or below, in addition to your current level. A combination of lower priced items e.g. goats, mice and bees will reduce the target price while the number of items to be sold to reach each target level will increase. Scaling up means the price will increase but volume will reduce.


Summary (Part 2)


In Part 2 of this series of blog posts we have briefly reviewed the roles of:

  • Volume
  • Demand

Both of these factors play a very significant role in achieving target Revenue.  

Did you gain any new insights from this list regarding the volume or demand?  Which other strategies specific to volume and demand have you used to increase revenue?

Please note there are more blog posts to follow.  We hope and trust that you found this information useful.  If you liked this blog post, please share or tweet or repost this article to others who may also be interested in these topics.


© Cogniplex 2017

Tuesday 24 October 2017

30 Different Ways To Build A 1 Billion Business (Part 1)


30 Ways to build a 1 Billion Business


30 Different Ways to Build a Billion Business 

24 Oct 2017

Abstract

This series of blog posts focus at a high-level on various approaches to increase company revenue/turnover and discusses each in brief. Some well-known international and potentially lesser known examples from South Africa or neighbouring countries are included. These blog articles are aimed at business readers, ranging from corporate executives to entrepreneurs and founders searching for strategies to increases revenue. It is equally suitable for interested parties who wish improve their general knowledge around strategies and growth.  

The full series will contain 3 or 4 articles. This post is Part 1

Estimated reading time: 7 min or less


0. Background


The inspiration for this article comes from a blog post by venture capital partner, Mr Christoph Janz, posted in 2014, "Five ways to build a $100 million business", and subsequent articles here and here

Mr Janz' article was itself an expansion on an earlier article by Mr Boris Wertz, "The only 2 ways to build a $100 million business".  

While some of the concepts included in Mr Janz's articles were used as the basis for this series,  there are some key differences:

  • The original focussed purely on the e-Commerce & SaaS markets, while this series of posts go much broader into different industries,
  • We have adjusted for local conditions and markets,
  • The original article was limited to 5 ways, this expands up to 30 ways.

1.   Introduction


There are different ways to turn your business into a Billion turnover (or more) company. In this article, we will delve deeper into some of the factors and considerations at play. This series of blog posts will look at various companies in a variety of industries. The discussion is therefor not limited to start-ups, unicorns, or e-commerce.


One Billion - Austin Powers

Fig 1.1 One BILLION 
Courtesy: Austin Powers, Capella International

While most of the examples in this article substantially focus on the topic of billion (Rand) revenue/turnovers, this does not mean that you should stop reading if:
  •     Your company is pre-revenue or turnover is e.g. 7 million …i.e. well   below a Billion;
  •      You are a brick-and-mortar company or not a brick-and-mortar company;
  •     Your company is already well in excess of a Billion;
  •     Your company uses another base currency e.g. U$ or € and not ZAR;

Various principles outlined in this article can still be applied to great effect in order to increase company turnover and take the business to the next level, whatever level your next level is - even if it means reducing examples below by a zero or two, or adding a zero or 2, or ignoring or substituting the currency symbol for your own purposes.

This article is based on the assumption that there is already a fully functioning business and an active and sufficient large market. Within the chosen target market, a business would target specific demographics or groups of customers, and specific markets to serve. These groups of customers can be either be broadly classified as:
  • Public sector – meaning you provide goods or services to either national government, local government, city and town councils, or State Owned Entities,
  • Business or industrial customers (for purposes of this article clustered together which means you are in the Business-to-Business or B2B market), or
  • Individual consumers (Business-to-Consumer or B2C market).Within these markets, there are sub-sections again, some of which we may cover later. Certain companies might target more than one group of customers, e.g. Public Sector and B2B, or both B2B and B2C. It is entirely possible that companies serving more than 1 group of customers might do so from different departments, divisions or perhaps even different subsidiaries.

In order to reach a billion in annual sales, the options are broadly as follows:

2.   Change the Target Product or Market mix


For the purposes of this discussion, each of the animals in the market matrix below is a mascot representing a specific market or product segment.

Billion Turnover Mascot Matrix

Fig 1.2.  Product or Market Matrix

To keep the maths simple, this diagram has illustratively been based on the logarithmic scale.  Please note: international or larger U$ denominated markets may be segmented slightly different from what is indicated in the discussion below. However the principles stand – there will be some market overlap based on local market conditions:

2.1 Catch a Whale – 


Landing a whale is not quite as easy as one might imagine - just ask any your circle of friends which one of them ever pulled a whole whale out of the sea. Chances are none have. In the local context this would mean landing 1 x Rand billion single year transaction.

Catching a whale

Fig 1.3 Artwork Credit: Frits Ahlefeldt


In the local market landing a whale is difficult and rather scare – Reason being is that locally there are not that many whale catchers (companies or individuals able to land and successfully deliver on a billion Rand transaction), and also not that many whales (opportunities) waiting to be caught. However it does happen. In other countries with larger economies, more whales can be found.

Locally, and even regionally, these type of transactions would most definitely be commercial in nature – either in the Public Sector (e.g. infrastructure or construction), or alternatively private sector B2B at enterprise level (large companies or groups of companies). For example, it might include sale of assets (such as huge tracks of land, office buildings or shopping centres), or sales of companies or shares (pension funds and investments).

There is likely to be some extent of risk for the parties involved.


2.2        Bag an Elephant (or 10) – 


         If you are in the market to hunt for elephants, you would have to bag 10 elephants at a price of R 100 million each in one year to reach a billion.

Elephants are easier to find than whales so while these transactions are not quite abundant, they would be more common. The transaction would still most probably be commercial in nature and involve either Public Sector and or the Private sector (B2B). This would definitely target the enterprise market e.g. large-scale ERP implementations, or industrial equipment such as smelters or sale of large assets such as property or businesses.

It should be noted R 100 million is at the high-end for the ultra-rich locally when it gets to big ticket purchases. This may e.g. include luxury personal assets such as property.


2.3        Hustle up a Herd of Hippos  


         100 hippos going for R10 million will bring home R 1 billion.

These transactions will commonly be B2B commercial type transactions either with the Public Sector or Private Sector, for example, IT systems developments for enterprises or medium-sized businesses or manufacturing equipment such as bottling plants or mining equipment. 

This could however also include top-end luxury items for wealthy consumers such as property.

2.4       Seize a Tower of Giraffes – 


A group of giraffes is occasionally referred to as a tower or more commonly, a herd. At a sales price of R 1 million you only need 1 thousand sales. 

These transactions could be either B2B (business-to-business) or at the high-end of the B2C (business-consumer).  Included in this list is personal or business assets such as property (land, entry level houses, townhouses, flats or personal construction projects), luxury vehicles, and business transactions such as consulting assignments, smaller industrial assets such as medium or heavy vehicles, system implementations or other professional services.


2.5         Find a forkl of Kudu 

          
         10 thousand clients at R100 000 per client

(According to Google "forkle" is an actual word, but again you can stick to herd if that feels more comfortable).

If your market is Kudus, you need to find 10 thousand transactions at R 100 000 per item. These transactions could be B2B (business-to-business) or can be B2C (business-consumer) but it should be noted they are at the middle to higher-end of the B2C market. This could include high-end electronics such as sound systems or home cinema systems, small construction projects such as bathroom renovations or new home kitchens. Also included would be business targeted services such as consulting or professional services.


2.6        Gather a flock of Goats

100 thousand customers buying R 10 0000 items from you

These transactions can be B2C (business-consumer) or B2B (business-to-business). This could be bigger personal assets such as jewellery, furniture, middle to high range cell phones, or business services such as software licenses or subscription services.


2.7        Fascinate a fluffle of Bunnies 


          Catch one million bunnies at a R 1000 per bunny

These transactions could e.g. be B2C (business-consumer) or B2B (business-to-business). Examples could be luxury consumer products such as shoes, entry-level electronics, car tyres, or services such as life insurance or short term insurance.


2.8 Corner a colony of Mice

        10 million mice at R 100 per transaction

You need to catch 10 million mice, or 10 million transactions of R 100 each to reach a billion. These transactions can be B2C (business-consumer) or could also include B2B (business-to-business). Examples could include physical consumer items such as clothing, groceries, restaurant meals, services or information products such as insurance or airtime.


2.9        Catch a swarm of Bees   

       100 million bees at R 10 per transaction

If you target bees, to reach a billion you would need 100 million transactions at R 10 each. R 10 transactions happen daily all around us. These transactions can be B2C (business-consumer) or maybe even B2B (business-to-business).

Examples could include e.g. consumer goods such as grocery items such as margarine, illuminating paraffin (approximately max retail price at time of going to press), or airtime. 


= = = = =


Moving on to another consideration ...

In addition to the above, the following options can be considered on a case-by-case basis to increase your turnover. It should be note that these strategies may be influenced by market or other economic or industry specific variables: 


Pricing is fundamentally important


3. Change the sales price


3.1 Increase price


McKinsey & Co. studied the Global 1200 (top 1200 companies in the world) and found that if they raised prices by just 1% — subject to demand remaining constant — profits would go up on average by 11% (hbr.org/2012/07/use-pricing-strategy-to-boost).


This is not merrily a cases of randomly pushing prices up. Prior to making any changes to the pricing structure we recommend conducting a benchmarking exercise to determine competitors’ pricing. This would also include a determination of value-for-money and perceived value/quality inherent in your own product or service offering vis-à-vis your competitor’s products or services. If your pricing is significantly lower than that of competitors, and/or if you offer more value or quality compared to competitors, then you could be losing out due to offering lower prices.

Other considerations include:


  • Consider price elasticity of demand. If demand is inelastic, meaning demand does not reduce when prices increases, there might be scope for increases,
  • Availability of complimentary products – if you produce butter while your competitors sell margarine (or any other almost perfectly acceptable substitute for your product), increases in your pricing might send customers to the competition.


3.2        Reduce price


It might feel counterintuitive, but under certain circumstances reducing prices can also increase the sales volume, depending on the demand curve for your product or service. This can be ascertained on a case-by-case and product-by- product basis by targeting key or significant customers in order to determine their willingness to purchase higher volumes for any given reduction in price.


Steam Library Example


Fig 1.4 Steam Library


Consider the case of Steam - one good example that gamers will know about: Steam is a multi-player platform developed by Valve Corporation. It is used to distribute computer type games and related media online, a type of specialised e-Commerce platform. During 2009 Steam held a sale for a specific computer game title, during which time prices were heavily discounted. When they dropped prices by 75%, this resulted in a 1470 % increase in sales. Another undisclosed game title achieved a 36 000 % jump in sales, however the discount applicable for that specific sale was not disclosed.

Another example is offering price reductions on available, but unused capacity. This equates to e.g. reducing the price of bus tickets outside of prime rush hour periods or after say 21:00 at night. If the bus runs the whole route in any event, reducing the price might result in more bums on seats (subject to demand at that time). A key consideration is that fixed cost is still covered (possibly during normal hours) and variable costs (if any) is marginal, or still covered by the reduced pricing. Also refer to the Ster Kinekor movie theatre example mentioned later under loyalty programs.


It should be noted that in instances where price deductions do not automatically result in volume increases, any ill-considered reduction can have a significant and negative impact on gross profit. Again this exercise would have to be approached with caution, and be limited to small decreases. This will require a benchmarking of competitors’ pricing, determining demand curves, as well as a rigorous assessment of margins and contribution prior to implementation.


         3.3  Change currency & export


While selling products or services inside SA (or most other countries), vendors are typically limited to charging domestic customers in their local currency. If however, you are able to compete cost efficiently overseas or in neighbouring countries (after taking into consideration additional costs of export, transport, storage and handling), valuable foreign exchange can be earned in the process.


Example: Local product sells for R 120, but the equivalent product sell for $9.95 in neighbouring countries. If the additional expenses are not significantly more for the exported product, the sales price achieved could be R 132.41 vs R 120 (based on U$ vs ZAR exchange rate as at 16 Oct 2016). 


3.4        Upsell


A good example of upselling occurs when purchasing a new motor vehicle. The basic car on offer might come with 4 tyres, standard seats, an adequate engine and a steering wheel. And maybe a five speed fan on entry level vehicles. The sales person will then take the buyer through a long and confusing list of upgrades, add-ons, or other more expensive items to “bling” up the vehicle including warrantees, guarantees, motor plan extensions etc.


Fig 1.5 Artwork Credit: Mark Anderson

If the seats come standard as material, the upgrade might be leather, with a premium price e.g. for super-soft suede. The vehicle will come in standard unimaginative colours, but metallic paint will cost more. Ditto if there is a basic radio, the upgrade might have GPS touch screen, while the top-of-the-line might come with a premium surround-sound and DVD system.


The profit margins on add-ons are typically higher than on the basic item.


3.5        Value-based pricing 


Value-based pricing is a pricing strategy which sets prices primarily, but not exclusively, based on the perceived or estimated value of that product or service to the customer, rather than according to the cost of the product or historical prices.


Consider the customer’s willingness to pay, is typically contingent on the sum of the perceived benefits which accrue to the customer on purchase of your product. When seen from a customer point-of-view, if buying your product is a no-brainer, it could mean the combined value-offering of all the features presents a high ratio of value for money when compared to the price he or she has to pay to acquire it.


Summary (Part 1)


In Part 1 of this series of blog posts we have briefly reviewed the roles of:

  • Product & Market Mix
  • Price

Both of these factors play a very significant role in achieving target Revenue. While Product & market mix sets the foundation, Pricing is affected by the demand for the product, determines Profit, and influences the Volume of Sales.

Did you gain any new insights from this list regarding the product / market mix or pricing?  Which other strategies specific to pricing or mix have you used to increase revenue?

Please note there are more blog posts to follow.  We hope and trust that you found this information useful.  If you liked this blog post, please share or tweet or repost to others who may also be interested in reading this article.


© Cogniplex 2017

Wednesday 6 September 2017

Business Model Innovation

Time for another blog post!

We found another interesting video which we believe would be relevant for business owners and entrepreneurs to see:

 This time on Business Model Innovation, brought to you courtesy of the Universität St.Gallen (HSG) 


Video courtesy of Universität St.Gallen (HSG)

4 Key questions at the heart of every business:

  1. Who is your target customer?
  2. What services or products do you offer to this customer?
  3. How do you create a Value Proposition?
  4. How do you generate Revenue?


Recommended viewing for entrepreneurs, founders, business owners and executive management. 

Cogniplex (Pty) Ltd claims no rights to this content - ownership resided with the creators and owners.

Wednesday 2 August 2017

Why do I need Business Intelligence (BI) or Data Analytics in my business?


Business is a numbers game

This article is a joint publication by Cogniplex and Blestec

Being on top of your business’ numbers is crucial in today’s highly competitive environment. Everything that moves or breathes (or doesn’t breathe) is classified as an income or cost centre, maybe as a controllable fixed cost or variable cost, and reported in Income Statements and in asset registers.

However, not every bit of important business information is denominated in Rand, Dollars or Yen. Various important bits of information could have a huge impact on the bottom line – to mention a few these could be
:
  • number of units manufactured or sold, 
  • kilometres driven per vehicle per month, 
  • SKUs moved through the warehouse, 
  • average overtime hours per month, 
  • mean variation on production run time, 
  • evaporation or shrinkage losses. 

These numbers might be hidden in databases or hiding in plain sight in call-centre or customer satisfaction reports that nobody ever reads, or lurking in proof-of-delivery documents and time sheets. Despite them being hidden from public view, these "hidden" numbers could ultimately make or break a business.


What is Data Analytics and Business Intelligence (BI)?


Data analytics is the process of examining all these sources of data, finding trends, adding meaning to and assisting management to draw conclusions based on this data.

Business intelligence (BI), according to Gartner, is an umbrella term that includes the software applications, infrastructure and tools, as well as the best practices that enable access to and analysis of information to improve, optimize decisions and performance.


Courtesy of www.timoelliott.com


BI encapsulates large-scale decision support in organisations:
  • BI provides management with a holistic view of the business and enables management to make informed decisions with regard to the business,
  •  It can contribute to the reducing costs, improving performance or opening up new business opportunities, or
  • It can assist to identify non-value adding activities or poor processes for optimisation.
Some examples of how analytics and or BI can add value to your business:
  • In a large capital intensive companies, maintaining the asset register is an important but often neglected function to be passed around to the new employee. Some admin clerks might record fleet trucks as “M/B”, others as “Mercedes”, “M.Benz”, “Merc” or “Mercedes Benz”. Model numbers might be recorded more haphazardly. Equipment descriptions could be equally vague and might be recorded as “MF4000”, “HP”, “Hewlett Packard”, or simply “Sally Exec Office Printer”. Over time such an asset register or database loses integrity due to incomplete fields, incorrect descriptions, and inconsistent data formats. For mergers & acquisitions, or even the implementation of an asset register module or financial system, a comprehensive, complete and accurate database is required. Data analytics systems can be used to scrub (clean up) such data by analysing huge volumes of data, identifying and flagging disparate data fields for correction.

  • In retail environments, management is focussed on creating a better customer shopping experience. BI can be used to great effect in making daily operational decisions such as micro segmentation to enhance decision making on store performance, product performance or even customer segmentation. When omnichannel decisions, real-time promotions or dynamic pricing comes in to play, the volume of data points can be so overwhelming that it dictates real-time electronic data analytics. Predictive analytics can also be used in demand forecasting, for out-of-stock analysis as well as pricing optimization.
  • Finance & Procurement can use BI to create automated standard reports in a fraction of the time that it would take to manually compile the reports, thereby freeing up valuable manpower. Daily performance tracking and accurate management information via dashboards can prevent nasty surprises at the end of the month or quarter. Analytics can be used to get to the bottom of spend, measuring and monitoring expenditure, identifying suppliers and contracts offering further opportunities for saving or to align and optimise procure-to-pay processes. Software or Platform as a Service (SaaS or PaaS) companies need to track various metrics meticulously to calculate e.g. Customer Acquisition Cost (CAC), Customer Lifetime Value (LCV), Churn or Monthly Recurring Revenues (MRR) per customer.  At a more strategic level, specialised predictive BI tools can be used for:
o   scenario planning,
o   provide guidance on whether to open up new branches or not,
o   make predictions on sales or expenses, profitability or
o   risk analyses and credit management in order to maximise ROCE. 

Executive Reporting Dashboard
Example of an Executive Reporting Dashboard – courtesy of Klipfolio
  • In Banks, Insurance houses or other players in the financial industry, different legacy IT systems are often used, each serving a different purpose. Customer information may reside in a Customer Information Database and Account details in the Accounts database. These data sources may furthermore reside in different business units altogether. In order to make meaningful decisions based on a full client view, data analytical tools offer features that aid in merging and or cleaning data (Extract, Transform, Load (ETL) data pipeline).  
  • Management information needs differ between different business units and even different departments, what Marketing needs vs what the Call Centre needs to see.  Marketing needs to stay on top of CRM e.g. leads received, vs leads converted into actual sales, calculating Net Promotor Scores or preparing models on the marketing mix. They also need to keep track of which products each client purchased for warranty purposes and or client retention. Specialised analytical packages are used for social media such as Twitter, Facebook, Instagram or Pinterest to analyse the effectiveness of key words, sales conversion campaigns, conduct A/B testing on landing pages or perform heat map analysis on websites. Outbound Call Centres may need Customer Segmentation, sales conversions and tracking of sales processes. Inbound Call Centres have to deal with call volumes, call service ratings, event reporting, tracking and escalating client complaints. BI packages can be used to create dashboards that reflect live data of call volumes, complaints, and escalation. Call Centre management depends on this management information to make resource re-allocations on the go, depending on caller volumes.
  • Supply Chain can greatly improve its operational efficiency when it has access to real-time intelligence into logistics: orders volumes vs warehouse stock levels, analysing on-time-delivery vs actuals, and driver-location and behaviour. BI can provide granular visibility on transport and logistic costs so that these can be managed more effectively e.g. diagnostic analytics to identify vehicles dedicated to specific routes which require disproportionate high maintenance, battery or tire replacements compared to fleet or model average. Specialist analytic systems can perform route optimisation calculations to improve efficiency, save cost and money.  
Supply Chain Dashboard
Example of a Supply Chain Dashboard – courtesy of Klipfolio


    • Data analytics are used as far afield as professional sport, in Rugby, Football, Cycling, and Basketball where it combines data from GPS, accelerometers, gym sessions and fitness trackers with video and other data sources to identify opportunities for improvement, prepare for matches, select players or even to influence game strategy. A sports science company in France is developing a smart “compressive” garment with French elite rugby team Stade Toulousain, which includes GPS, heart rate, speed and other monitoring hardware.

    As can be seen from the examples above, BI and or Analytics can contribute to improved efficiency at various levels in the business: 

    • Strategic BI - Strategic Business Intelligence informs management if the company is on target to meet its primary objective/goals or not. It also assists management to take corrective actions if they see the ship is veering off course.                                                                                                                                                                         Business focus: Achieve long term organizational goals e.g. maximise ROI
    Strategic Dashboard
    Strategic Dashboard courtesy of www.datapine.com

    Tactical BI
    The Tactical Business Intelligence looks at historical data to see if enough has been sold compared to last month and whether there is inventory to meet expected demands. 

    Business focus: Conduct medium to short term analysis to achieve strategic goals


    Tactical Dashboard Example
    Tactical Dashboard courtesy of www.informationbuilders.com

    • Operational BI - The Operational Business Intelligence is an immediate reactive business process.                                                                                                   
      Operational Dashboard
      Operational Dashboard courtesy of www.dundas.com/
      Business focus: Manage daily operations, integrate BI with operational systems


    How can my business benefit from this?


    "How can my business benefit from BI or data analytics" -  The short answer to that is as follows:

    • Saving time and money e.g. to prepare reports: having automated processes can increase accuracy, and reliability while freeing up resources from repetitive and time-consuming activities such as report drafting. There is no longer a need to have someone who will pull data from different systems to a spreadsheet, then analyse it and present it. A scalable BI solution can do all that for you and deliver it to your mobile device, while you are sitting in a restaurant, saving you time and money. 

    • Providing high-quality management information and improving decision making - BI can assist you to make informed decisions faster, and more accurately, based on actual facts and figures. BI can also compare information between locations, periods, products or services. 

    • Increase efficiency within the business: BI can increase efficiency in your business, identify business processes or service areas which require improvement, optimise stock levels, or reduce stock-outs or improve response times. This can be achieved in many ways, e.g. automated processes can increase reliability and efficiency while the rest of your staff are freed up to focus on other matters of the business. 

    Which type of businesses should seriously consider implementing BI and or data analytics?

    • Companies with various data sources or an IT landscape made up of various disparate systems and disjointed databases in legacy systems, each keeping a portion of data, where selected data from different sources has to be extracted and merged to provide an overarching view and richer analytics; 
    • Companies with databases that are incomplete, with incorrect descriptions, and inconsistent data conventions requiring scrubbing, or preparing data sets for system implementation or due diligence type transactions; 
    • Companies requiring management dashboards and business metrics for Finance, Call Centres or other operational units; 


    • Companies which: 
             - Are drowning in Excel spreadsheets and bits of paper, 
             - Are struggling to manually analyse or interpret huge volumes of data, 
             - Require assistance interpreting data, or converting data,
             - Require management information for operational and strategic decision making,  
             - Cannot afford to continue with guess work or educated hunches, 
             - Need to improve quality and turn-around of decision making, 
             - Strive to improve efficiency and streamline operations, 
             - Need to identify cost savings, increase profitability or ROI

    If you recognise any of the above-mentioned challenges or symptoms in your company, feel free to contact us today to find out how we can help you.


    If you liked this article, please feel free to share or send to a friend who may benefit from reading this


    This article is a joint publication by Cogniplex and Blestec


    For more information, or to request a consultation, please contact us: 

    Contact:    Cogniplex - Benjamin on 011 839 1536
                      Blestec     - Sibusiso on  079 106 8435


    IOT Supplychain Visibility Test 947

      Supply Chain Visibility real-world experiment @ Ride Joburg 947 Cycle Challenge This past weekend was one of the highlights of the cycli...