Doing business in a time of Coronavirus/Covid-19, Supply Chain disruption and Business interruption - Where and How did this crisis originate?
NOTE:
- This is a developing situation. Accordingly, role players continue to react and markets continue to adjust to the emerging situation. The historical data, facts and figures contained in this article were accurate at the time of publication, but statistical figures and some facts can change over time (e.g. share prices, mortality figures, etc). References below for further reading.
- This article will be posted into 3 parts:
- Part 1. What
happened and how did we get here? (Word count: ±852)
- Part 2. How can the current crisis affect commerce and industry? (Word
count: ±1080)
- Part 3. What are the business priories – immediate and over the next few months? (Word count: ±1675)
PART 1 – What happened and how did we get here?
2020 is fast turning into a watershed year. In
early January the global economy was chugging along nicely, with some
international Indexes peaking around record highs. However, New Year euphoria
was cut short as news gradually broke about a virus spreading in Wuhan, China.
 |
| Figure 1 - Wuhan Map |
Wuhan is a hi-tech hub and China’s “motor city”. It
is the biggest city in Hubei province, known as the “thoroughfare of China” by
virtue of being a transport and industrial hub for central China and the
region’s political, economic and commercial centre. More than 300 of the
world’s top 500 companies have a presence here.
By 13 January, the first case was identified in
nearby Thailand. By 22 January
2020, the novel coronavirus (subsequently referred to as Covid-19) had spread
to major cities and provinces in China, with 571 confirmed cases and 17 deaths
reported. On 23 January 2020 (2 days before Chinese New Year), authorities
informed residents of Wuhan of an imminent lockdown from 10 am. An
estimated 300 000 citizens left the city immediately. The lockdown spread
as quarantine was imposed in various cities and regions. On this same day that
the lockdown occurred, the first case of Corona was identified in Singapore. From early
February, Chinese authorities began shutting down factories in a desperate
attempt to halt the spread of the virus.
This plan did not work, and virus contagion spread
to the rest of the world. And economic contagion followed – the following is a
summary:
- China is the world's manufacturer and is also the world’s largest container cargo handler and home to seven of the world's 10 busiest container ports – processing around 30% of global traffic or around 715,000 containers a day in 2019
- The
lockdowns meant that factories could not get stock shipped out that was
already manufactured and simultaneously stopped manufacturing altogether.
China’s manufacturing activity plunged to an all-time low in February,
with the official manufacturing purchasing managers’ index (PMI) slowing
to 35.7, according to the National Bureau of Statistics
(NBS). Comparatively, during 2008’s Financial Crisis the manufacturing PMI only dropped to 38.8 in November 2008. Services were similarly affected, and the services index almost halved last month to just 26.5 from 51.8 in January (and first time lower than 50 since the index was started 15 years ago in late 2005.
- Ports
had insufficient capacity to load and offload ships. The Ningbo-Zhoushan
Port Authority, in the city of Ningbo, typically has 24,000 registered
container truck drivers. By Feb 12 only 800 truck drivers were working. Ships
could not get into Chinese ports, as the loading and discharging of goods
slowed down
and shipping traffic dropped 19.8% in February from a year earlier.
- Incoming
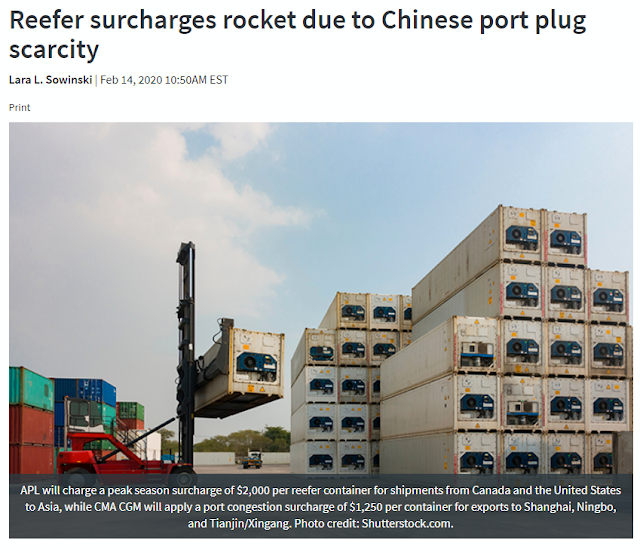
cargo clogged ports and shipping lines started charging surge fees for refrigerated containers importing food. Some cargo ships left China carrying as little as 10% of TEU capacity, others cancelled trips.
- Overall
China’s exports and imports plunged. Exports fell by 17.2% in January and
February combined compared to the same period a year earlier, according to
the General Administration of Customs
- A survey by Beijing-based think tank the Shanghai International Shipping
Institute shows that capacity utilisation at the main Chinese ports fell
by 20-50%, while more than one-third of ports said storage facilities were
more than 90% full.
International impact
This lowered throughput had a knock-on effect on
the other side of the Supply Chain in receiving countries:
- LA
handled 705 000 containers in Feb 2019. The same period Feb 2020 was down to 544 000 or 22.87%. By 18 March Los Angeles ports have seen 40 +
“blank sailings” - ships scheduled to arrive that didn’t, numbers previously unheard of.
- On
the Asia-Europe trade route, at least 61 cancelled sailings have been announced, representing a 151,000 TEU capacity reduction. China
typically represents about 30% of Hamburg's container throughput and about
25% of Rotterdam's. Rotterdam
Port Authority estimated that a 1% drop in its annual volume, which after recording throughput of 14.8 million TEU would amount to 148,000 TEU. Hamburg harbour reported a 40% plunge in trade volumes.
Oil Price War
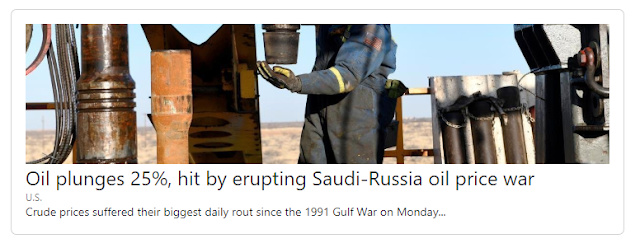
Then, on 8 March 2020, after a potential oil
production cut agreement with Russia fell flat, Saudi Arabia initiated a price war with Russia. This triggered
an immediate international fall in the price of oil, with US oil prices falling by 34%, crude oil falling by 26%, and Brent oil falling by 24%. Oil prices
dropped to 18-year lows. For more info see here and here
CONCLUSION
The fallout and contagion (both medically and
financially speaking) spread nearly globally in the space of 3 months. This
caught many off-guard, as global supply chains and financial markets were disrupted. In
the next post, we will consider the potential and combined impact of the virus,
supply chain interruptions and business disruption on commerce and industry,
and potentially on your own business or organisation where you work.
If you like this post, please Like, Share and Comment
For more information, visit our website on www.cogniplex.co.za. A copy of this article is also posted on Linkedin.com
All original artworks remain the property of their respective owners.


No comments:
Post a Comment