Business is a numbers game
However, not every bit of important business information is denominated in Rand, Dollars or Yen. Various important bits of information could have a huge impact on the bottom line – to mention a few these could be:
- number of units manufactured or sold,
- kilometres driven per vehicle per month,
- SKUs moved through the warehouse,
- average overtime hours per month,
- mean variation on production run time,
- evaporation or shrinkage losses.
These numbers might be hidden in databases or hiding in plain sight in call-centre or customer satisfaction reports that nobody ever reads, or lurking in proof-of-delivery documents and time sheets. Despite them being hidden from public view, these "hidden" numbers could ultimately make or break a business.
What is Data Analytics and Business Intelligence (BI)?
Business intelligence (BI), according to Gartner, is an umbrella term that includes the software applications, infrastructure and tools, as well as the best practices that enable access to and analysis of information to improve, optimize decisions and performance.
Courtesy of www.timoelliott.com
BI encapsulates large-scale decision support in organisations:
- BI provides management with a holistic view of the business and enables management to make informed decisions with regard to the business,
- It can contribute to the reducing costs, improving performance or opening up new business opportunities, or
- It can assist to identify non-value adding activities or poor processes for optimisation.
- In a large capital intensive companies, maintaining the asset register is an important but often neglected function to be passed around to the new employee. Some admin clerks might record fleet trucks as “M/B”, others as “Mercedes”, “M.Benz”, “Merc” or “Mercedes Benz”. Model numbers might be recorded more haphazardly. Equipment descriptions could be equally vague and might be recorded as “MF4000”, “HP”, “Hewlett Packard”, or simply “Sally Exec Office Printer”. Over time such an asset register or database loses integrity due to incomplete fields, incorrect descriptions, and inconsistent data formats. For mergers & acquisitions, or even the implementation of an asset register module or financial system, a comprehensive, complete and accurate database is required. Data analytics systems can be used to scrub (clean up) such data by analysing huge volumes of data, identifying and flagging disparate data fields for correction.
- In retail environments, management is focussed on creating a better customer shopping experience. BI can be used to great effect in making daily operational decisions such as micro segmentation to enhance decision making on store performance, product performance or even customer segmentation. When omnichannel decisions, real-time promotions or dynamic pricing comes in to play, the volume of data points can be so overwhelming that it dictates real-time electronic data analytics. Predictive analytics can also be used in demand forecasting, for out-of-stock analysis as well as pricing optimization.
- Finance & Procurement can use BI to create automated standard reports in a fraction of the time that it would take to manually compile the reports, thereby freeing up valuable manpower. Daily performance tracking and accurate management information via dashboards can prevent nasty surprises at the end of the month or quarter. Analytics can be used to get to the bottom of spend, measuring and monitoring expenditure, identifying suppliers and contracts offering further opportunities for saving or to align and optimise procure-to-pay processes. Software or Platform as a Service (SaaS or PaaS) companies need to track various metrics meticulously to calculate e.g. Customer Acquisition Cost (CAC), Customer Lifetime Value (LCV), Churn or Monthly Recurring Revenues (MRR) per customer. At a more strategic level, specialised predictive BI tools can be used for:
o scenario planning,
o provide guidance on whether to open up new branches or not,
o make predictions on sales or expenses, profitability or
o risk analyses and credit management in order to maximise ROCE.
 |
| Example of an Executive Reporting Dashboard – courtesy of Klipfolio |
- In Banks, Insurance houses or other players in the financial industry, different legacy IT systems are often used, each serving a different purpose. Customer information may reside in a Customer Information Database and Account details in the Accounts database. These data sources may furthermore reside in different business units altogether. In order to make meaningful decisions based on a full client view, data analytical tools offer features that aid in merging and or cleaning data (Extract, Transform, Load (ETL) data pipeline).
- Management information needs differ between different business units and even different departments, what Marketing needs vs what the Call Centre needs to see. Marketing needs to stay on top of CRM e.g. leads received, vs leads converted into actual sales, calculating Net Promotor Scores or preparing models on the marketing mix. They also need to keep track of which products each client purchased for warranty purposes and or client retention. Specialised analytical packages are used for social media such as Twitter, Facebook, Instagram or Pinterest to analyse the effectiveness of key words, sales conversion campaigns, conduct A/B testing on landing pages or perform heat map analysis on websites. Outbound Call Centres may need Customer Segmentation, sales conversions and tracking of sales processes. Inbound Call Centres have to deal with call volumes, call service ratings, event reporting, tracking and escalating client complaints. BI packages can be used to create dashboards that reflect live data of call volumes, complaints, and escalation. Call Centre management depends on this management information to make resource re-allocations on the go, depending on caller volumes.
- Supply Chain can greatly improve its operational efficiency when it has access to real-time intelligence into logistics: orders volumes vs warehouse stock levels, analysing on-time-delivery vs actuals, and driver-location and behaviour. BI can provide granular visibility on transport and logistic costs so that these can be managed more effectively e.g. diagnostic analytics to identify vehicles dedicated to specific routes which require disproportionate high maintenance, battery or tire replacements compared to fleet or model average. Specialist analytic systems can perform route optimisation calculations to improve efficiency, save cost and money.
 |
| Example of a Supply Chain Dashboard – courtesy of Klipfolio |
- Data analytics are used as far afield as professional sport, in Rugby, Football, Cycling, and Basketball where it combines data from GPS, accelerometers, gym sessions and fitness trackers with video and other data sources to identify opportunities for improvement, prepare for matches, select players or even to influence game strategy. A sports science company in France is developing a smart “compressive” garment with French elite rugby team Stade Toulousain, which includes GPS, heart rate, speed and other monitoring hardware.
As can be seen from the examples above, BI and or Analytics can contribute to improved efficiency at various levels in the business:
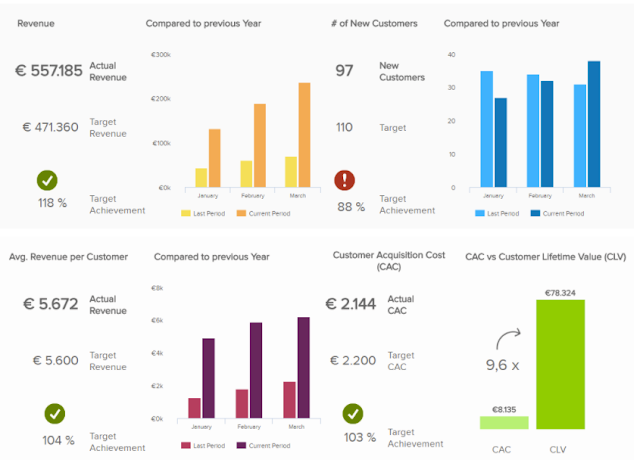
- Strategic BI - Strategic Business Intelligence informs management if the company is on target to meet its primary objective/goals or not. It also assists management to take corrective actions if they see the ship is veering off course. Business focus: Achieve long term organizational goals e.g. maximise ROI
 |
| Strategic Dashboard courtesy of www.datapine.com |
Tactical BI - The Tactical Business Intelligence looks at historical data to see if enough has been sold compared to last month and whether there is inventory to meet expected demands.
 |
| Tactical Dashboard courtesy of www.informationbuilders.com |
-

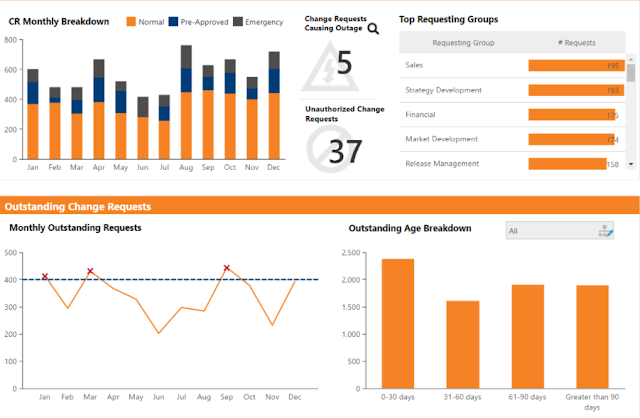
Operational Dashboard courtesy of www.dundas.com/ Business focus: Manage daily operations, integrate BI with operational systems
How can my business benefit from this?
"How can my business benefit from BI or data analytics" - The short answer to that is as follows:
- Saving time and money e.g. to prepare reports: having automated processes can increase accuracy, and reliability while freeing up resources from repetitive and time-consuming activities such as report drafting. There is no longer a need to have someone who will pull data from different systems to a spreadsheet, then analyse it and present it. A scalable BI solution can do all that for you and deliver it to your mobile device, while you are sitting in a restaurant, saving you time and money.
- Providing high-quality management information and improving decision making - BI can assist you to make informed decisions faster, and more accurately, based on actual facts and figures. BI can also compare information between locations, periods, products or services.
- Increase efficiency within the business: BI can increase efficiency in your business, identify business processes or service areas which require improvement, optimise stock levels, or reduce stock-outs or improve response times. This can be achieved in many ways, e.g. automated processes can increase reliability and efficiency while the rest of your staff are freed up to focus on other matters of the business.
Which type of businesses should seriously consider implementing BI and or data analytics?
- Companies with various data sources or an IT landscape made up of various disparate systems and disjointed databases in legacy systems, each keeping a portion of data, where selected data from different sources has to be extracted and merged to provide an overarching view and richer analytics;
- Companies with databases that are incomplete, with incorrect descriptions, and inconsistent data conventions requiring scrubbing, or preparing data sets for system implementation or due diligence type transactions;
- Companies requiring management dashboards and business metrics for Finance, Call Centres or other operational units;
- Companies which:
- Are struggling to manually analyse or interpret huge volumes of data,
- Require assistance interpreting data, or converting data,
- Require management information for operational and strategic decision making,
- Require management information for operational and strategic decision making,
- Cannot afford to continue with guess work or educated hunches,
- Need to improve quality and turn-around of decision making,
- Need to improve quality and turn-around of decision making,
- Strive to improve efficiency and streamline operations,
- Need to identify cost savings, increase profitability or ROI
If you recognise any of the above-mentioned challenges or symptoms in your company, feel free to contact us today to find out how we can help you.
If you liked this article, please feel free to share or send to a friend who may benefit from reading this
This article is a joint publication by Cogniplex and Blestec
For more information, or to request a consultation, please contact us:
Contact: Cogniplex - Benjamin on 011 839 1536
Blestec - Sibusiso on 079 106 8435


