Showing posts with label Business Intelligence. Show all posts

Wednesday, 1 June 2022

Operations and Supply Chain Visibility - what is it and why do you need it?


SYNOPSIS: Having no visibility, real-time insights, or reliable data on business operations or the current status of your supply chains is conceptually not too far removed from driving blind. This article briefly explains some use cases and advantages of operational and supply chain visibility platforms and systems.

ESTIMATED READING TIME: 5min

First posted on LinkedIn - read the ORIGINAL POST here

You wouldn’t drive your car blindfolded, would you?

Driving blind is a dangerous and potentially life-threatening practice, perhaps best left to trained movie stunt professionals on movie lots. The rest of us, social influencers included (even those with very deep pockets and extensive liability cover), should best stay far away.


While the image in the title has been Photoshopped somewhat, this image ☝️☝️ is the real deal and comes from a YouTube video in which a popular YouTuber filmed himself driving blindfolded. The video sparked a public outcry and negative news coverage, as one could expect. This resulted in the video initially being age-restricted and demonetised, and then subsequently removed by YouTube.

The risks caused by driving blind are rather obvious and easy for all to see - apart from the aforementioned YouTuber, and include at least the following:
  • Inability to see where you are going.
  • Inability to see how the situation around your vehicle and inside the vehicle is changing in real-time.
  • Inability to effectively make informed decisions in real-time or timeously execute corrective action to best adjust to the developing risks and changing situations around you.
  • You are very likely to cause or end up in an accident, incurring costs, losses and liability claims, including but not limited to loss of life.
Swimming in a Sea of Business, Operational and Supply Chain Risks

The same goes for managing and coordinating the various activities inside a business: in today’s equally volatile and fragile economic climate, no accountant worth his salt will manage the finances of a business blind-folded either – meaning without knowing with a reasonable degree of certainty how much the expenses are, who needs to be paid or when the payments are due, or how many invoices are outstanding and how much is owed by each debtor.

If visibility is such an obvious requirement for driving and finances, why are there parts of business operations that are still “operating in the dark”, figuratively speaking?

Have a look at almost any media outlet or newspaper and one will see headings describing losses, damages, delays, bottlenecks, shortages, and other supply chain challenges brought on by a mix of internal and external factors as well as foreseeable and unforeseeable risk events. Many existing but previously manageable challenges were upgraded and further exacerbated by the great Supply Chain crisis of 2021-2022. This in turn was brought on by (some would say ill-considered) pandemic emergency measures, which caused systemic shocks, stock outages, and shortages, shutdowns of suppliers (both temporary as well as permanent in nature); significant supply chain delays; economic hardship; and increased volatility around the world. In the process, some entirely new problems were created. The only constant is change.

In no specific order, below please find a short list of 12 examples of current supply chain and operational challenges, many of which may or could affect business operations in the Southern African (or international) market:


Please scroll through this list. While this is by no means intended to be an exhaustive or comprehensive list, it does highlight the wide range of challenges that local businesses confront from time to time, some of which occur daily, including:
  • Supply disruption due to lockdowns 
  • Cargo and freight handling delays, accidents and incidents
  • Wastage, damages and shrinkage to perishable foodstuffs, fresh fruit and veggies
  • Political unrest, riots and looting targeting the supply chain, transporters, and warehouses
  • Import and export delays, shipping delays, border congestion and delays
  • Counterfeit products, supply chain control gaps, shortages and stock-outages
  • Natural disasters, flooding, transport infrastructure (ports, docks and roads inaccessible), unavailability of services due electrical outages, water bursting, etc

Many of these problems are caused by external factors beyond the control of the average company; they are not isolated occurrences; they are not limited to specific suppliers or carriers; they are not necessarily industry-specific; and they can and do affect the entire Southern African economy, including international supply chain networks. And these issues have disastrous effects on operational efficiency and bottom-line profits. Research by McKinsey indicates that “supply-chain disruptions cost the average organization 45 percent of one year’s profits over the course of a decade.”. For South African businesses, the cost of e.g. importing goods has increased significantly, with a 400–500% cost increase for freighting a 12-meter container by sea from China to South Africa, even for large organisations with bargaining power. On some international trade routes, shipping costs have increased much more. Risk has increased significantly. Many of these costs are passed on to the consumer, who is now faced with rapidly increasing living expenses, rising inflation, and considerably less discretionary spending power, which, in turn, reverberates throughout the economy.

It is therefore advisable to use every tool in your arsenal to pro-actively respond to the changing situation around you. Because every load counts.

So what is Visibility?


Visibility platforms (software + tracking devices) compile and analyse real-time data across the shipping journey to provide end-to-end shipment visibility across different industry applications.

This means a commercial customer has the ability to track-and-trace assets or inventory live and in real-time, e.g. from the point where the item/shipment leaves the farmer's, manufacturer’s, supplier’s, or service provider’s warehouse/distribution centre up to the point where it arrives at the destination, allowing you to keep track of the current location, condition, and status of these items throughout the journey.
  • Visibility platforms are frequently used for supply chain visibility but can have other related applications, e.g. large and complex business operations. It is important to understand that the visibility requirements can vary somewhat between e.g. a logistics business/farmer/manufacturer/distributor/retailer/importer/exporter, which could be very different from the visibility requirements of a bank or a pension fund.
  • Different technologies are on offer and the platform can obtain data via API, directly from telematics or other types of tracking IOT devices.

6 Reasons why your business needs visibility


Consider how your company could profit from having Real-Time Visibility into your operations and access to a Single Version of the Truth:

  1. Transparency - having real-time end-to-end IOT visibility on where your operational assets/inventory/shipments are, with hyper-accurate location information, despite using numerous 3rd party logistics providers or channels, such as warehouses, handlers, or distributors in multiple locations
  2. Tracking important performance data - Key indicators such as transit time, stops and halt periods, loading times, or whether unauthorised pauses or unexpected delays occurred are all available on the fly. This provides you with knowledge, allowing you to forecast if your operational assets, inventory, or freight will arrive on time, ahead of plan, or behind schedule. And allows you to keep track of supplier performance.
  3. Auditability - Having an audit trail to prove real-time conditions of fragile or high-value inventory / perishable shipments. Knowing if the cargo was handled in accordance with SLA and or regulatory compliance requirements for the duration of the trip.
  4. Real-time condition reporting - Knowing the condition of your perishable/fragile shipments in real-time, and being able to pinpoint and allocate accountability for damage if and when it occurs.
  5. Real-time actionable insights to:

  • Make fact-based decisions to respond to and manage exceptions,
  • Reduce costs and minimise damage to fragile and perishable goods, shrinkage and or losses of high-value goods,
  • Identify operational bottlenecks,
  • Make data-driven decisions to develop business cases, mitigate risks or loss prevention strategies,
  • Improve the quality of forecasting and inventory management,
  • Maximise operational efficiency,
  • Increase customer satisfaction,
  • Improve profitability,
  • Withstand and defend against disruption.

The aforementioned cover some of the advantages that Visibility platforms have to offer – including aggregated, real-time data about the movement of freight along the shipping journey, providing end-to-end shipment visibility.

6. For rather obvious reasons, then, it comes as no surprise that research by the authoritative market intelligence and investment advisory firm, CBInsights, emphasised the importance of prioritising supply chain and operational visibility platforms as a focus area for retailers. What’s good for the goose …er retailer, is probably worth seriously thinking about for other players across different value chains and different industries, too.

So, if given a choice, you would not drive blindfolded, right? Where do you see Visibility adding the most benefit to your business?


Need more information? Want to start a pilot project? Please contact us


If you have found this article useful or thought-provoking, please share it with others in your company or industry.

#IOT #retail #supplychain #riskmanagement

Photo-credits:

All media belongs to their respective owners.

Shark photo Jacob Owens + Warehouse Photo by Bernd Dittrich found on Unsplash

Friday, 17 November 2017

Tesla disruptive Semi Truck 5 Real-world business implications

How Tesla's new Semi Truck will disrupt the Cargo & Freight Logistics Industries

17 November 2017

Introduction


On 16 November 2017 Tesla, and its founder Elon Musk, may just have pulled the carpet out under other truck and Semi manufacturers around the world. Competing manufacturers and fleet owners might have sleepless nights over the Tesla Semi Truck

Elon Musk launches the new Tesla Semi Truck
Elon Musk launches the new Tesla Semi Truck. Photo Credit: Elon Musk / Twitter

In a highly anticipated press release, choreographed more like a pop concert, the founder of Tesla threw down the gauntlet at other manufacturers as he arrived at the event in a new futuristic proto-type Semi Truck. The very imposing Semi Truck drove in and parked in a huge hangar where the launch event took place. 

A visibly excited and wise-cracking Musk jumped out and immediately starting sharing key performance stats with the audience:

Tesla Semi Truck Factsheet 


The vehicle is in every way as innovative and disruptive as it looks. Data below as presented at the launch:

  • Claimed Speed

o   0-60 mph (96.6km/h) in 5 secs unloaded
o   0-60 mph (96.6km/h) in 20 secs loaded at 80  000 pounds (36.2 ton)  gross max vehicle weight
o   Tesla can reach 65 mph (104.6 km/h) up a 5% incline compared to traditional diesel 45mph (at max gross weight)
  • Claimed Range

o   500 mile (804.6 km) range on a full charge at full weight at highway speed
o   Vehicle can charge sufficiently for 400-mile range in 30 min
o   Recharging through a planned solar-powered Tesla mega-charger network which could mean lower electrical costs compared to current Utility rates

Elon Musk at the launch of the Tesla Semi Truck
Elon Musk at the launch of the Tesla Semi Truck 
  •  Claimed technical specs

o   4 independent computer-controlled electrical motors
o   Effectively 1 continuous gear
o   Built-in computer system that can potentially integrate with 3rd party fleet IT systems
o   Drivetrain guarantee 1 million miles
o   Quasi-infinite brake life
o   No transmission, emission scrubbers or differentials
o   Thermo-nuclear explosion proof windscreen glass
o   Remote diagnostics – connected to Tesla Mobile Service
o   Predictive maintenance
o   Location tracking built-in
o   Built-in communication with Dispatch
  • Claimed Aerodynamics

o   Drag coefficient  0.36 vs traditional trucks 0.60-0.70
  • Safety

o   Enhanced auto-pilot
o   Automatic Emergency braking
o   Automatic lane Keeping
o   Forward collision warning
o   Built-in protection against jack-knifing via independently controlled electrical motors on wheels
o   IT communications connected to Emergency services

You can watch the launch here (redirect to Tesla's site) or below

Video material courtesy Market Reaction's Youtube Channel & Tesla

Overview 


The Tesla Semi Truck leapfrogs the traditional heavy vehicle / semi-truck segment, and not only in the way it looks. It threatens to make many other traditional competitors’ vehicles redundant.  

This Semi truck rewrites many of the rules associated with large vehicles. It has 4 independent computer-controlled motors. Tesla claims it is guaranteed that it will not break down next to the side of the road. So convinced are they that they offer a 1 million mile (1 609 km) drive train breakdown guarantee. This claim is based on the fact that the vehicle can continue to be driven even if 2 of the electrical motors fail simultaneously.


Tesla Semi Truck Interior - Driver's view
Tesla Interior - Driver's view - Pic Credit: Tesla / Business Insider

The cabin has been redesigned with the driver seated in the middle, surrounded by screens and huge windows. The screens update the driver continuously with relevant information, and presumably also display rear-facing cameras. 

The windows specifically are made of thermonuclear explosion-proof glass. This means the windscreen is less likely to crack from typical industrial or on-the-road type accidents or require replacement. Fewer replacements and maintenance requirements mean more time on the road generating revenue.


Tesla Semi Truck Interior - Cabin view
Tesla Semi Truck Interior - Cabin view. Pic Credit Tesla / Business Insider 

The brakes are regenerative, meaning every time you step on the brake that energy goes back to recharging the batteries. According to Mr Musk, theoretically, the brakes can last forever without needing replacement. At projected fuel rates of $2.5 / US gallon for diesel (1 US gallon = 3.78 liters metric), it is anticipated that a fully-loaded diesel fuelled truck will be at least 20% more expensive per mile than a new Tesla Semi.

The Tesla range also comes with convoy technology, allowing vehicles to operate as a road train in convoy (safely following one another). In the convoy scenario, a group of Diesel trucks is claimed to be 2x as expensive per mile to operate than a group of Tesla Semi trucks. This means the Tesla Semi even becomes serious competition for Rail freight in certain markets.

5 Real-world business implications of the Tesla Semi Truck


While the information available is limited and in some cases projected at this stage, sufficient information is available to conclude that this vehicle will be a game changer. Some of the real-world business implications might include:

  • Speed of business


The speed at which business can be conducted has just increased significantly. Leaving the impact of conventional traffic flow out of the argument, for now, trucks can arguably reach their destinations faster and more reliably (less roadside breakdowns). This means current capacity constraints are shifting, theoretically resulting in higher freight load capacity throughput. Whether or not this will be limited to marginal capacity increases, or not, remains to be seen.


The knock-on effect of higher capacity is that warehouses, docking areas, and loading bays will be under more pressure to turn-around vehicles. This, in turn, may necessitate the handling, racking/packing or dispatching of more SKUs per operating hour. Scheduled delivery windows will be impacted. Various aspects of business efficiency will be affected, also in downstream logistic clients such as the retail industry.

  • Income and Operating Costs including maintenance


Final market retail pricing is yet to be announced and the vehicles have to be tested and driven under less than ideal fleet and operational conditions. If however the trucks are priced not too disparate from traditional diesel trucks, this could translate to higher tonnage turned around per vehicle per day, and theoretically higher ROI.  

If the claimed costs materialize as low as promised, this means a huge shift in operating costs. Electrical engines have completely different maintenance profiles compared to fossil fuel combustion engines. Whether Tesla will allow owners to service their own vehicles in the same manner that some current truck manufacturers do, is unknown at this stage. This has a huge potential impact on current in-house workshops, stock keeping of spare parts, and stock levels, staffing and tooling requirements at in-house workshops. Also very significant implications for the spare parts and aftermarket value chain.

Driver training and the required skill set to qualify as a driver will be impacted as drivers may have to be more technically savvy than the traditional driver.


The whole efficient frontier shifts. Lower operating costs translates to either higher operating profits and or potentially putting old-school competitors out of business.

  • Fuelling and operating range


The vehicles are designed to have operating ranges sufficient to address typical US standards - 500 miles (804.6 km) range on a full charge at full weight at highway speed. How this pans out in e.g. places like Australia or North Africa where huge distances between towns are an issue, remains to be seen. 

The impact on the fossil fuel industry will be substantial. Truck stops may have to either join the Tesla network (if that is even possible) or convert infrastructure to switch over to electrical charging. The demand for solar technology and solar parks will increase substantially. 


At this stage it is not known if there will be alternatives to stopping at a designated recharging station - a workaround may be required either in the way of extra batteries to extend the range for remote regions, or local charging ability e.g. via solar panels.

  • Environmental considerations


City ordinances and environmental approval requirements that apply to approved locations for the traditional type filling stations or truck stops, may have to be changed. The current risk associated with fuel/gas storage or spillage or toxic contamination of water resources by oil, is either eliminated or materially reduced when using electrical vehicles.


In the long-run, emissions will be substantially reduced, so it is more environmentally friendly.

  • Big Data and Data Analytics


The vehicles are effectively permanently online and generating data – both technical data (e.g. typical operation data such as vehicle speed, battery charge level, and range) but also logistical information (GPS tracking location, distance remaining, time to destination remaining) – all real-time data feeding into logistical systems. 

The volume of data in real-time will increase exponentially. This means in some locations technical IT and telecoms infrastructure may need to be increased to provide the necessary capacity. More data storage will be required. Analytics capacity will have to be able to cope effectively with real-time data and a huge increase in data volume.


Overall the quality of Management Information Systems (MIS) may have to improve. This means Business Intelligence will improve, allowing management to make faster decisions on the fly.  This means reskilling and training in the back office at the head office too, and also at clients.


Conclusion


If Tesla’s final product holds up to the promises made, it will disrupt the heavy vehicle industry as well as the logistics industry. The knock-on effect of potential efficiency gains will be felt in all industries dependent on semi trucks. 

Tesla may very well have a product here that makes many competing products redundant … that is if competitors do not innovate and play catch-up FAST. In a speculative future scenario, fuel-driven vehicles may be banished to 3rd world countries, or only retained for very specific applications or deliveries to areas without the electrical and technical infrastructure required to support the Tesla Semi.

Production is targeted to commence in 2019, with delivery from 2021 onwards. Pre-orders are already open with a pre-payment of $ 5 000 per #Tesla Semi.  

If you liked this post, please share or tweet to others who may also be interested in this topic.

© www.cogniplex.co.za 


Wednesday, 2 August 2017

Why do I need Business Intelligence (BI) or Data Analytics in my business?


Business is a numbers game

This article is a joint publication by Cogniplex and Blestec

Being on top of your business’ numbers is crucial in today’s highly competitive environment. Everything that moves or breathes (or doesn’t breathe) is classified as an income or cost centre, maybe as a controllable fixed cost or variable cost, and reported in Income Statements and in asset registers.

However, not every bit of important business information is denominated in Rand, Dollars or Yen. Various important bits of information could have a huge impact on the bottom line – to mention a few these could be
:
  • number of units manufactured or sold, 
  • kilometres driven per vehicle per month, 
  • SKUs moved through the warehouse, 
  • average overtime hours per month, 
  • mean variation on production run time, 
  • evaporation or shrinkage losses. 

These numbers might be hidden in databases or hiding in plain sight in call-centre or customer satisfaction reports that nobody ever reads, or lurking in proof-of-delivery documents and time sheets. Despite them being hidden from public view, these "hidden" numbers could ultimately make or break a business.


What is Data Analytics and Business Intelligence (BI)?


Data analytics is the process of examining all these sources of data, finding trends, adding meaning to and assisting management to draw conclusions based on this data.

Business intelligence (BI), according to Gartner, is an umbrella term that includes the software applications, infrastructure and tools, as well as the best practices that enable access to and analysis of information to improve, optimize decisions and performance.


Courtesy of www.timoelliott.com


BI encapsulates large-scale decision support in organisations:
  • BI provides management with a holistic view of the business and enables management to make informed decisions with regard to the business,
  •  It can contribute to the reducing costs, improving performance or opening up new business opportunities, or
  • It can assist to identify non-value adding activities or poor processes for optimisation.
Some examples of how analytics and or BI can add value to your business:
  • In a large capital intensive companies, maintaining the asset register is an important but often neglected function to be passed around to the new employee. Some admin clerks might record fleet trucks as “M/B”, others as “Mercedes”, “M.Benz”, “Merc” or “Mercedes Benz”. Model numbers might be recorded more haphazardly. Equipment descriptions could be equally vague and might be recorded as “MF4000”, “HP”, “Hewlett Packard”, or simply “Sally Exec Office Printer”. Over time such an asset register or database loses integrity due to incomplete fields, incorrect descriptions, and inconsistent data formats. For mergers & acquisitions, or even the implementation of an asset register module or financial system, a comprehensive, complete and accurate database is required. Data analytics systems can be used to scrub (clean up) such data by analysing huge volumes of data, identifying and flagging disparate data fields for correction.

  • In retail environments, management is focussed on creating a better customer shopping experience. BI can be used to great effect in making daily operational decisions such as micro segmentation to enhance decision making on store performance, product performance or even customer segmentation. When omnichannel decisions, real-time promotions or dynamic pricing comes in to play, the volume of data points can be so overwhelming that it dictates real-time electronic data analytics. Predictive analytics can also be used in demand forecasting, for out-of-stock analysis as well as pricing optimization.
  • Finance & Procurement can use BI to create automated standard reports in a fraction of the time that it would take to manually compile the reports, thereby freeing up valuable manpower. Daily performance tracking and accurate management information via dashboards can prevent nasty surprises at the end of the month or quarter. Analytics can be used to get to the bottom of spend, measuring and monitoring expenditure, identifying suppliers and contracts offering further opportunities for saving or to align and optimise procure-to-pay processes. Software or Platform as a Service (SaaS or PaaS) companies need to track various metrics meticulously to calculate e.g. Customer Acquisition Cost (CAC), Customer Lifetime Value (LCV), Churn or Monthly Recurring Revenues (MRR) per customer.  At a more strategic level, specialised predictive BI tools can be used for:
o   scenario planning,
o   provide guidance on whether to open up new branches or not,
o   make predictions on sales or expenses, profitability or
o   risk analyses and credit management in order to maximise ROCE. 

Executive Reporting Dashboard
Example of an Executive Reporting Dashboard – courtesy of Klipfolio
  • In Banks, Insurance houses or other players in the financial industry, different legacy IT systems are often used, each serving a different purpose. Customer information may reside in a Customer Information Database and Account details in the Accounts database. These data sources may furthermore reside in different business units altogether. In order to make meaningful decisions based on a full client view, data analytical tools offer features that aid in merging and or cleaning data (Extract, Transform, Load (ETL) data pipeline).  
  • Management information needs differ between different business units and even different departments, what Marketing needs vs what the Call Centre needs to see.  Marketing needs to stay on top of CRM e.g. leads received, vs leads converted into actual sales, calculating Net Promotor Scores or preparing models on the marketing mix. They also need to keep track of which products each client purchased for warranty purposes and or client retention. Specialised analytical packages are used for social media such as Twitter, Facebook, Instagram or Pinterest to analyse the effectiveness of key words, sales conversion campaigns, conduct A/B testing on landing pages or perform heat map analysis on websites. Outbound Call Centres may need Customer Segmentation, sales conversions and tracking of sales processes. Inbound Call Centres have to deal with call volumes, call service ratings, event reporting, tracking and escalating client complaints. BI packages can be used to create dashboards that reflect live data of call volumes, complaints, and escalation. Call Centre management depends on this management information to make resource re-allocations on the go, depending on caller volumes.
  • Supply Chain can greatly improve its operational efficiency when it has access to real-time intelligence into logistics: orders volumes vs warehouse stock levels, analysing on-time-delivery vs actuals, and driver-location and behaviour. BI can provide granular visibility on transport and logistic costs so that these can be managed more effectively e.g. diagnostic analytics to identify vehicles dedicated to specific routes which require disproportionate high maintenance, battery or tire replacements compared to fleet or model average. Specialist analytic systems can perform route optimisation calculations to improve efficiency, save cost and money.  
Supply Chain Dashboard
Example of a Supply Chain Dashboard – courtesy of Klipfolio


    • Data analytics are used as far afield as professional sport, in Rugby, Football, Cycling, and Basketball where it combines data from GPS, accelerometers, gym sessions and fitness trackers with video and other data sources to identify opportunities for improvement, prepare for matches, select players or even to influence game strategy. A sports science company in France is developing a smart “compressive” garment with French elite rugby team Stade Toulousain, which includes GPS, heart rate, speed and other monitoring hardware.

    As can be seen from the examples above, BI and or Analytics can contribute to improved efficiency at various levels in the business: 

    • Strategic BI - Strategic Business Intelligence informs management if the company is on target to meet its primary objective/goals or not. It also assists management to take corrective actions if they see the ship is veering off course.                                                                                                                                                                         Business focus: Achieve long term organizational goals e.g. maximise ROI
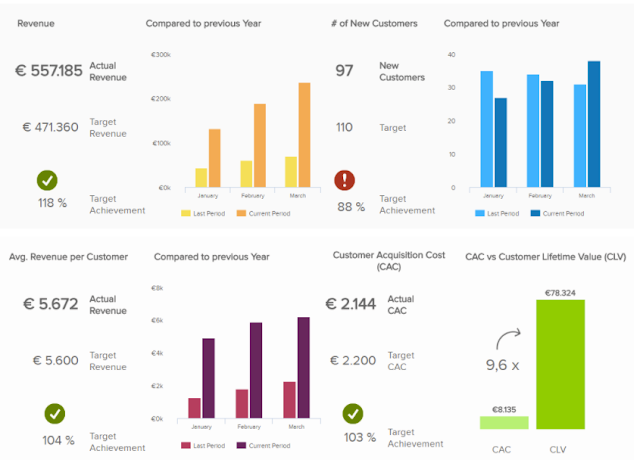
    Strategic Dashboard
    Strategic Dashboard courtesy of www.datapine.com

    Tactical BI
    The Tactical Business Intelligence looks at historical data to see if enough has been sold compared to last month and whether there is inventory to meet expected demands. 

    Business focus: Conduct medium to short term analysis to achieve strategic goals


    Tactical Dashboard Example
    Tactical Dashboard courtesy of www.informationbuilders.com

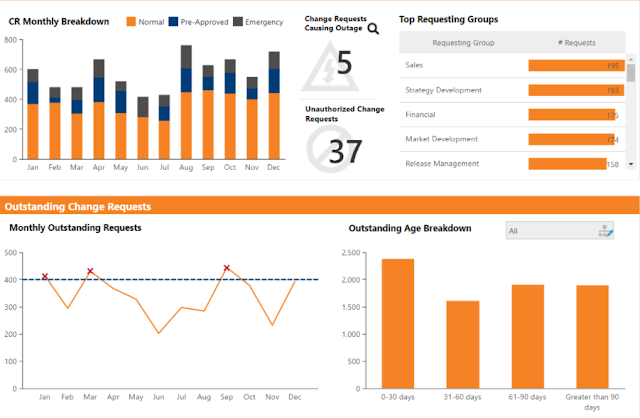
    • Operational BI - The Operational Business Intelligence is an immediate reactive business process.                                                                                                   
      Operational Dashboard
      Operational Dashboard courtesy of www.dundas.com/
      Business focus: Manage daily operations, integrate BI with operational systems


    How can my business benefit from this?


    "How can my business benefit from BI or data analytics" -  The short answer to that is as follows:

    • Saving time and money e.g. to prepare reports: having automated processes can increase accuracy, and reliability while freeing up resources from repetitive and time-consuming activities such as report drafting. There is no longer a need to have someone who will pull data from different systems to a spreadsheet, then analyse it and present it. A scalable BI solution can do all that for you and deliver it to your mobile device, while you are sitting in a restaurant, saving you time and money. 

    • Providing high-quality management information and improving decision making - BI can assist you to make informed decisions faster, and more accurately, based on actual facts and figures. BI can also compare information between locations, periods, products or services. 

    • Increase efficiency within the business: BI can increase efficiency in your business, identify business processes or service areas which require improvement, optimise stock levels, or reduce stock-outs or improve response times. This can be achieved in many ways, e.g. automated processes can increase reliability and efficiency while the rest of your staff are freed up to focus on other matters of the business. 

    Which type of businesses should seriously consider implementing BI and or data analytics?

    • Companies with various data sources or an IT landscape made up of various disparate systems and disjointed databases in legacy systems, each keeping a portion of data, where selected data from different sources has to be extracted and merged to provide an overarching view and richer analytics; 
    • Companies with databases that are incomplete, with incorrect descriptions, and inconsistent data conventions requiring scrubbing, or preparing data sets for system implementation or due diligence type transactions; 
    • Companies requiring management dashboards and business metrics for Finance, Call Centres or other operational units; 


    • Companies which: 
             - Are drowning in Excel spreadsheets and bits of paper, 
             - Are struggling to manually analyse or interpret huge volumes of data, 
             - Require assistance interpreting data, or converting data,
             - Require management information for operational and strategic decision making,  
             - Cannot afford to continue with guess work or educated hunches, 
             - Need to improve quality and turn-around of decision making, 
             - Strive to improve efficiency and streamline operations, 
             - Need to identify cost savings, increase profitability or ROI

    If you recognise any of the above-mentioned challenges or symptoms in your company, feel free to contact us today to find out how we can help you.


    If you liked this article, please feel free to share or send to a friend who may benefit from reading this


    This article is a joint publication by Cogniplex and Blestec


    For more information, or to request a consultation, please contact us: 

    Contact:    Cogniplex - Benjamin on 011 839 1536
                      Blestec     - Sibusiso on  079 106 8435


    IOT Supplychain Visibility Test 947

      Supply Chain Visibility real-world experiment @ Ride Joburg 947 Cycle Challenge This past weekend was one of the highlights of the cycli...